
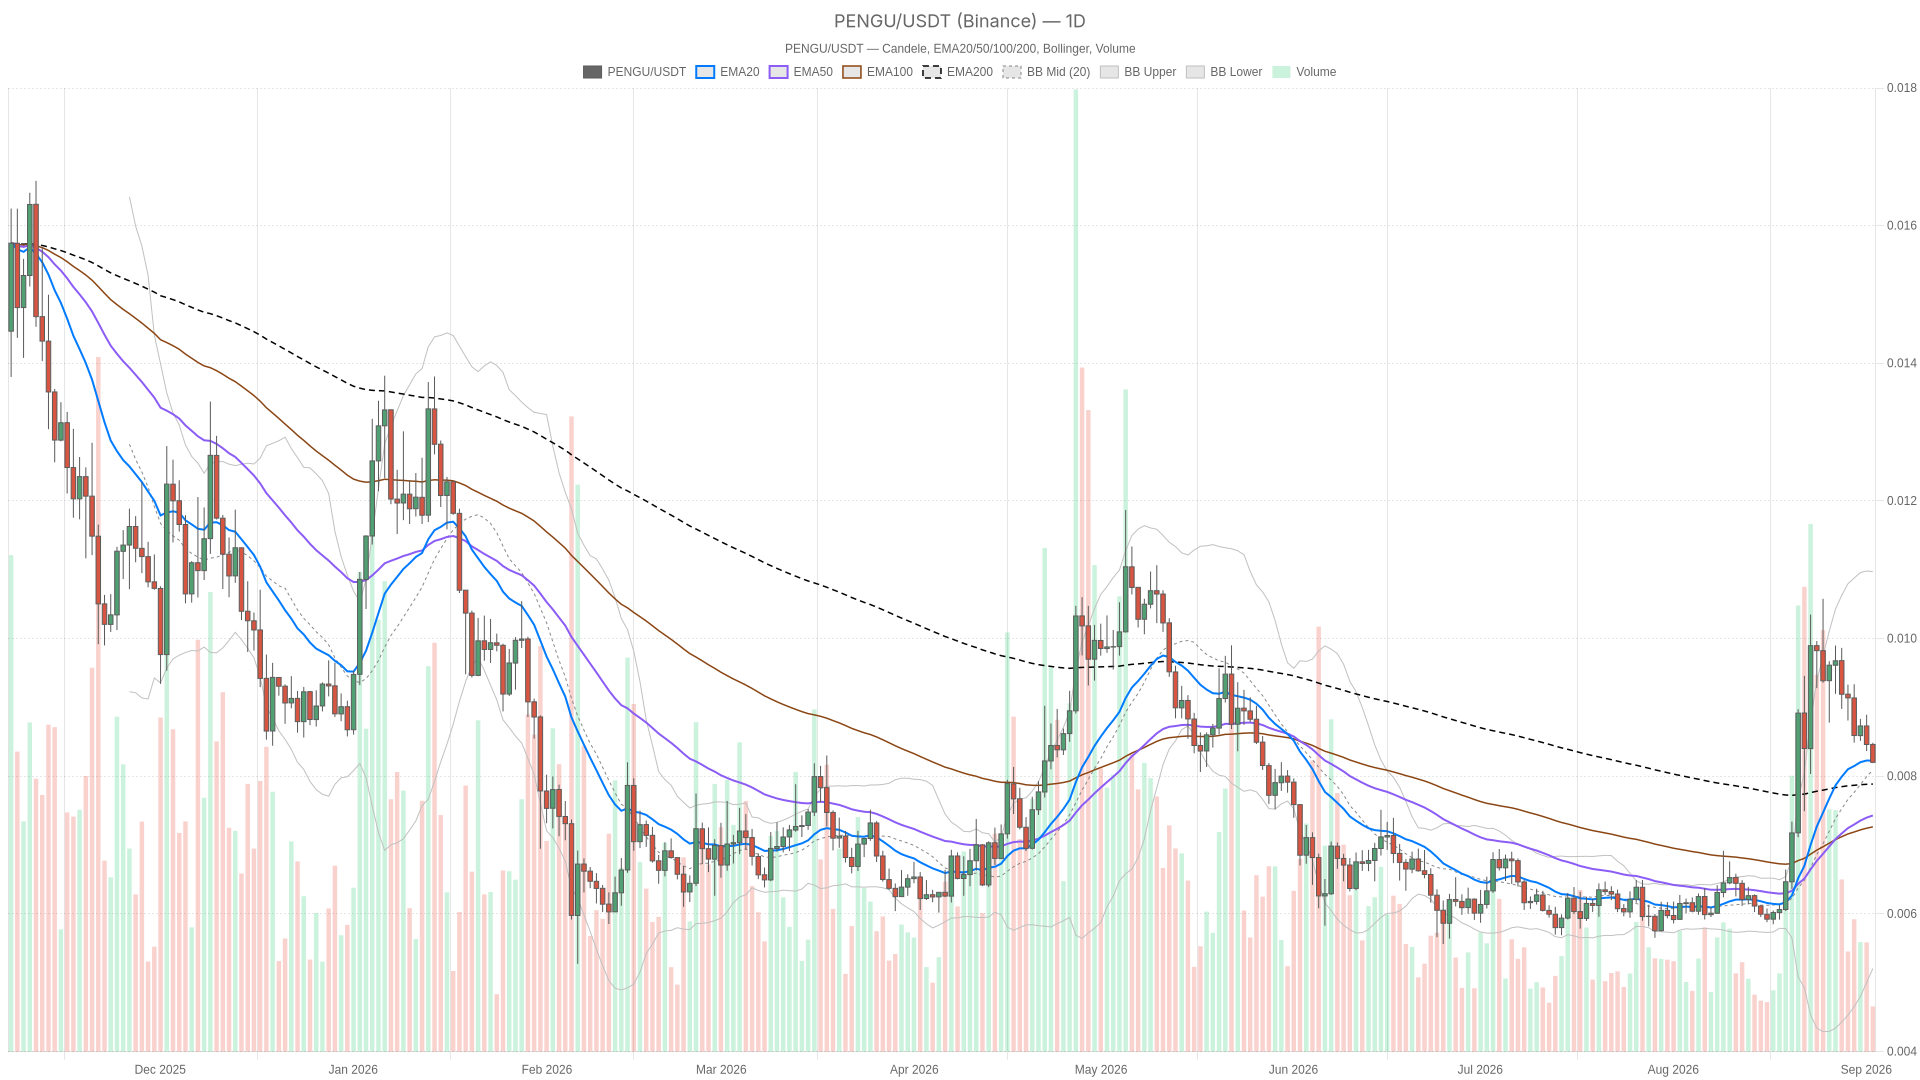
As of September 2, 2026, the daily chart for Pudgy Penguins crypto reflects a market stuck firmly in neutral. The RSI sits at 53.02, while total crypto market capitalization slipped 3.53% to roughly $2.59 trillion. Bitcoin dominance held at 59.09% during the pullback, signaling capital rotation rather than outright retreat.
Pudgy Penguins Crypto Analysis: Neutral Momentum with Imminent Volatility
As of September 2, 2026, the daily chart for Pudgy Penguins crypto reflects a market stuck firmly in neutral. The RSI sits at 53.02, while total crypto market capitalization slipped 3.53% to roughly $2.59 trillion. Bitcoin dominance…
The Cryptonomist
Publisher
Sep 2, 2026 at 10:48 AM UTC · 5 min read
Market Impact
BTC-1.93%$76,562
Last Updated
10 minutes ago
Key takeaways
- PENGU’s daily RSI sits at 53.02, a perfectly neutral reading with no directional bias on the daily chart.
- The 1-hour and 15-minute charts show bearish regimes, with RSI values of 30.97 and 31.52 respectively.
- Bollinger Bands are compressed across all timeframes, signaling an imminent volatility expansion once the squeeze resolves.
- Total crypto market capitalization fell 3.53% in 24 hours, while Bitcoin dominance held at 59.09%.
- The Fear & Greed Index reads 63 (Greed), creating a notable gap between sentiment and actual price action.
Trend Structure vs. Short-Term Momentum
The daily chart for PENGU currently shows no trending bias. It is neutral, with price awaiting a catalyst to define the next directional move. However, the 1-hour and 15-minute timeframes have already shifted into bearish territory, with RSI readings of 30.97 and 31.52 indicating that intraday sellers hold control for now.
Market Context
Bitcoin
BTC
$76,631
-1.85% (24H)
Market Cap
$1.54T
24H Volume
$26.3B
24H High
$78,392
Article Intelligence
Key Entities
UniswapFluid
Sponsored
Ad
NewsLayerLearn more
NewsLayer Premium
Unlock deeper intelligence.
Ad-free reading, exclusive research, and real-time onchain insights.
Go Premium