
Trading at $0.85 on August 22, 2026, the Sui crypto market sits at a critical juncture, with daily charts flashing overbought warnings while the hourly structure remains constructively bullish. The tension between exhaustion and continuation makes the next few sessions decisive.
Sui crypto rally hits overbought extremes as DeFi fees jump 913% weekly
Trading at $0.85 on August 22, 2026, the Sui crypto market sits at a critical juncture, with daily charts flashing overbought warnings while the hourly structure remains constructively bullish. The tension between exhaustion and…
Cryptonews.net
Publisher
Aug 22, 2026 at 3:16 PM UTC · 6 min read
Key Signal
$0.85 SUI trading price
Market Impact
Total MCap-1.07%
Last Updated
2 months ago
Key takeaways
- Sui trades at $0.85 as of August 22, 2026, with the daily RSI at 75.79, firmly in overbought territory.
- DeFi protocol fees across Momentum, Cetus, Bluefin, DeepBook, and Turbos have surged with Turbos posting a 913.09% weekly increase.
- The hourly chart maintains a bullish EMA stack, but MACD momentum is flattening near the highs.
- The $0.84–$0.86 pivot zone will likely determine whether the rally extends toward $0.95 or pulls back to $0.76.
- Total crypto market cap hovers around $2.63 trillion with Bitcoin dominance at 58.8%, limiting altcoin rally sustainability.
Daily Chart: Overbought Signals Against a Still-Bearish Structure
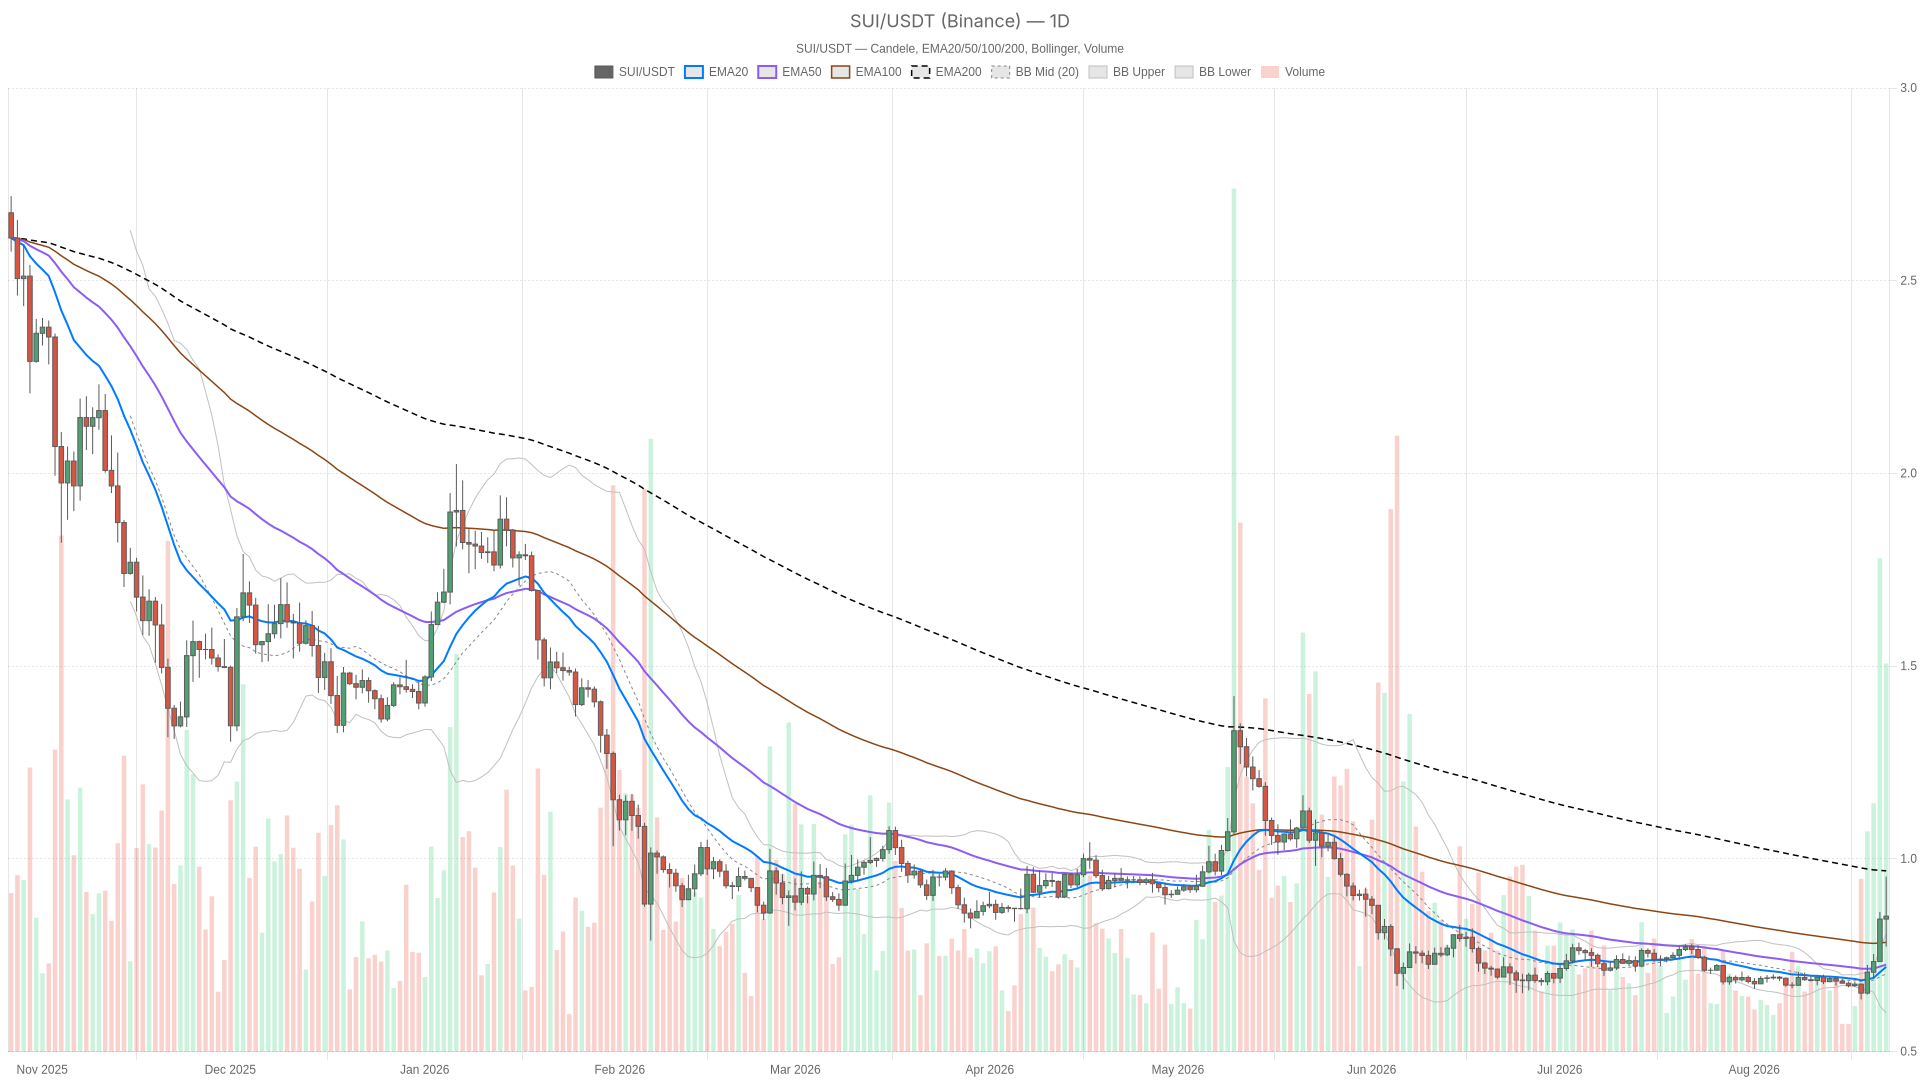
The daily chart shows price has become overbought during a recovery leg that remains below the 200-EMA, meaning the broader trend has not yet flipped bullish despite the sharp bounce. At $0.85, price trades above both the 20-EMA at $0.72 and the 50-EMA at $0.73, but it remains well under the 200-EMA at $0.97. That overhead resistance is a critical detail: the short-term moving averages have curled up, yet the long-term trend line still points lower.
Market Context
Bitcoin
BTC
$75,723
+0.00% (24H)
Market Cap
$1.52T
24H Volume
$21.0B
24H High
$76,301
Article Intelligence
Sponsored
Ad
NewsLayerLearn more
NewsLayer Premium
Unlock deeper intelligence.
Ad-free reading, exclusive research, and real-time onchain insights.
Go Premium