
US Dollar, Sterling, Bitcoin Weekly Technical Outlook
Chart Prepared by Michael Boutros, Sr. Technical Strategist; DXY on TradingView
stonex.com
Publisher
Sep 21, 2026 at 5:15 PM UTC · Updated an hour ago · 3 min read

Entities
bitcoin
Market Impact
BTC+6.66%$86,566
Last Updated
an hour ago
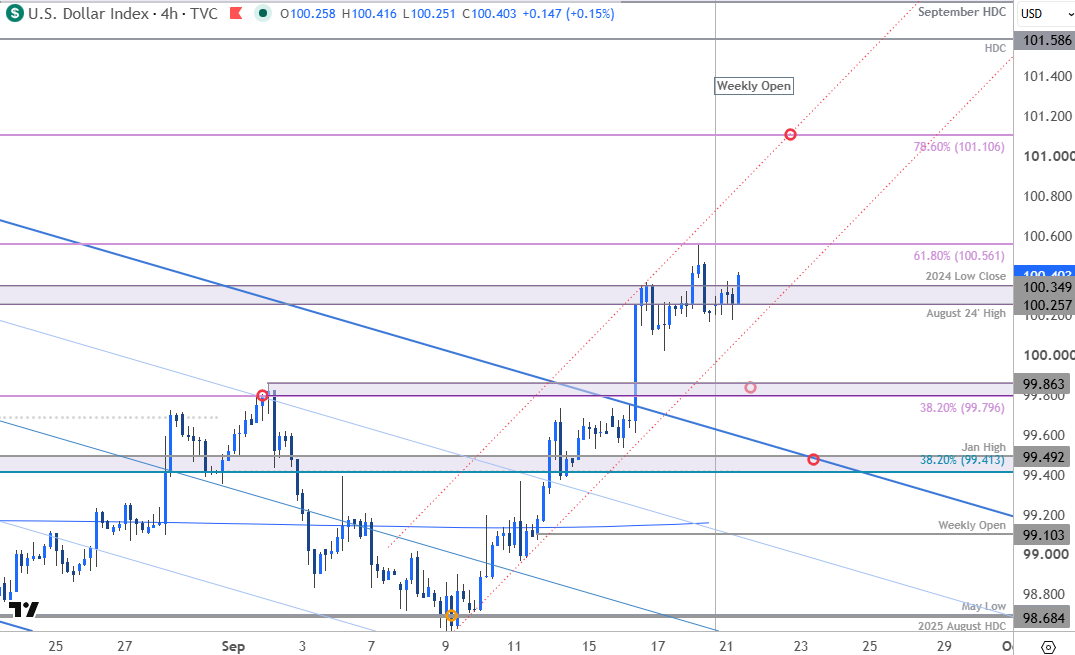
Chart Prepared by Michael Boutros, Sr. Technical Strategist; DXY on TradingView
Notes: The U.S. Dollar Index is testing a key pivot zone at the August 20204 high and the 2024 low close at 100.26/35. The breakout of the September opening range last week keeps the focus on a late-month high, but the rally does need to clear this key zone on a close basis to keep the immediate advance viable in the days ahead.
Initial support rests with the channel line off the monthly low and is backed by 99.80/86- a region defined by the 38.2% retracement of the June decline and the September opening range high. Broader bullish invalidation is now raised to the 38.2% retracement of the yearly range and the January high at 99.41/49.
Initial resistance is eyed at the 61.8% retracement / September high at 100.56. A breach / daily close above this threshold is needed to mark resumption of the monthly uptrend with subsequent resistance objectives eyed at 101.11 and the yearly high-day close at 101.59.
Bottom line: The Dollar rally has extended nearly 2% off the monthly low with the index testing a pivotal resistance near 8-week highs. From a trading standpoint, losses would need to be limited to 99.80 IF price is heading higher on this stretch with a close above 100.56 needed to fuel the next leg higher in the index.
Market Context
Bitcoin
BTC
$86,564
+6.66% (24H)
Market Cap
$1.74T
24H Volume
$40.1B
24H High
$86,900
Article Intelligence
Key Entities
Topics
Related Coverage
 CryptoUS Dollar Majors, Bitcoin, Gold, Oil Weekly Technical Outlook3 hours ago · 4 min read
 CryptoBitcoin Just Hit an Eight-Month High But XRP Is Still 38% Below Its January Peak. What's Holding It Back?34 minutes ago · 4 min read
 CryptoWill Bitcoin become legal tender in the U.S.? Plus, why crypto isn’t waiting for CLARITY36 minutes ago · 1 min read
Sponsored
Ad
NewsLayerLearn more
NewsLayer Premium
Unlock deeper intelligence.
Ad-free reading, exclusive research, and real-time onchain insights.
Go Premium