
This post may contain links from our sponsors and affiliates, and Flywheel Publishing may receive compensation for actions taken through them.
What Bitcoin Did Every Time It Fell to Its 200-Week Average
This post may contain links from our sponsors and affiliates, and Flywheel Publishing may receive compensation for actions taken through them.
24/7 Wall St.
Publisher
Nov 13, 2026 at 5:59 PM UTC · 3 min read
Key Signal
$68,700 Bitcoin current price
Entities
bitcoin
Market Impact
BTC-1.82%$67,639
Last Updated
9 hours ago
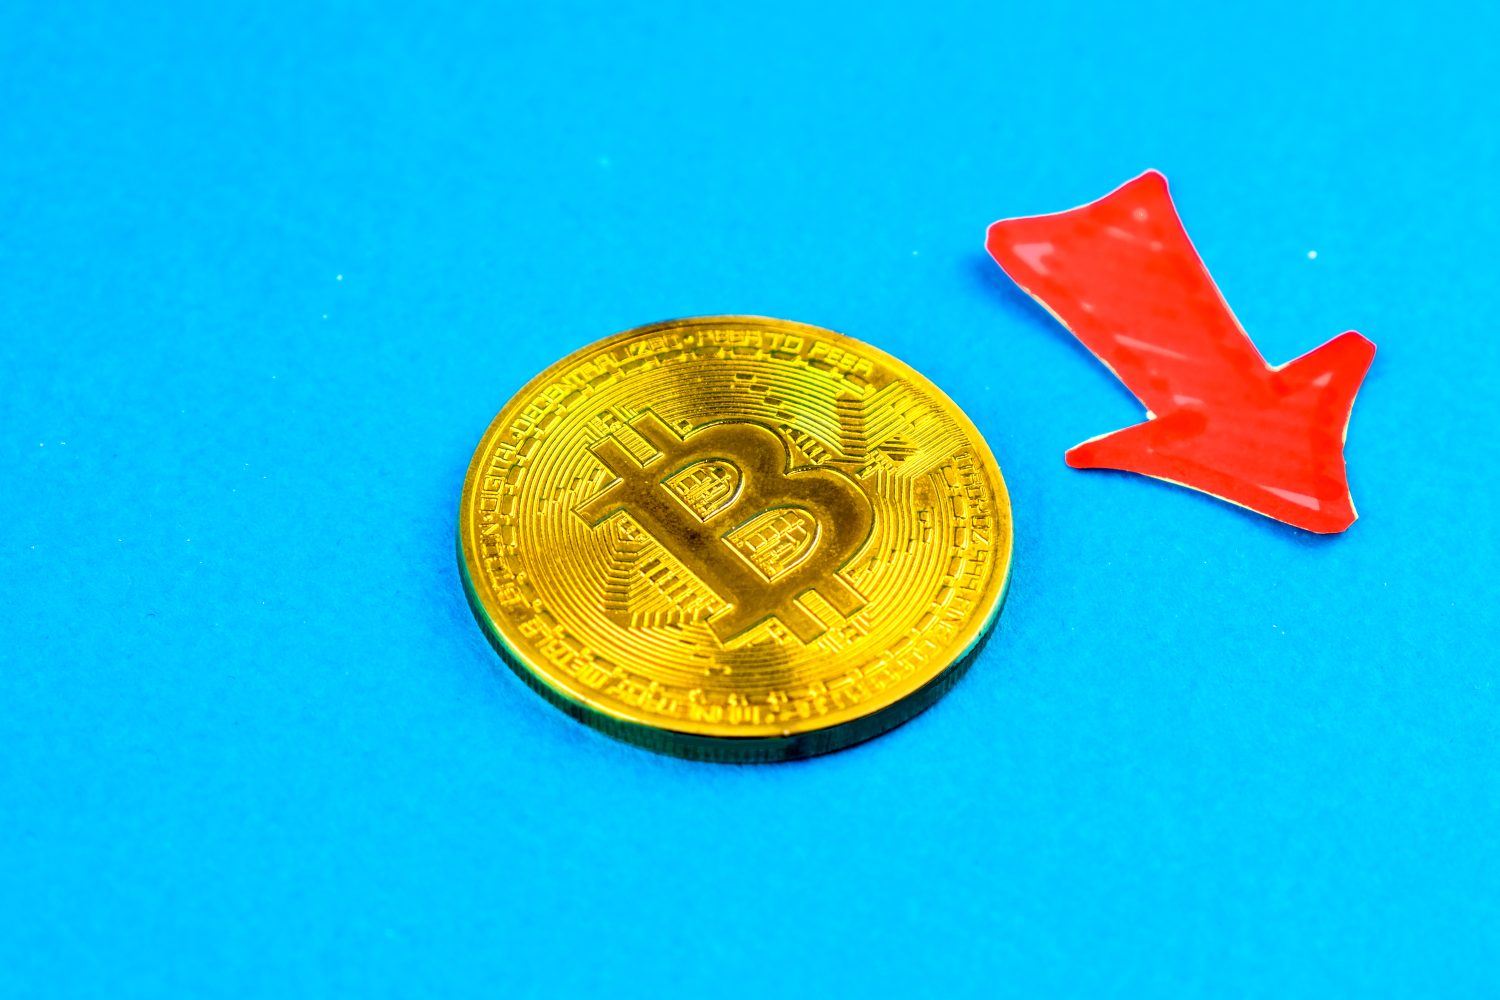
Bitcoin (CRYPTO:BTC) has once again dipped to its 200-week moving average, a key line many long-term investors see as support. This average tracks Bitcoin’s weekly closes over roughly four years, filtering out day-to-day price swings. Bitcoin trades at around $68,700, following an intraday low of $67,555, its lowest daily low since August 19.
That puts Bitcoin 45.5% below its all-time high of $126,080 from October 6, 2025. While this support line has been broken before, each previous dip offers insight into what typically follows. So what did Bitcoin do every time it fell to this average?
Bitcoin Has Dropped Back to Its 200-Week Average

According to analysts at crypto exchange Bitfinex, Bitcoin has closed below $75,400 for six consecutive days, roughly the average price recent buyers paid. Many of these buyers now face losses and could sell during rebounds, adding supply as Bitcoin tries to regain that level. Bitfinex says a weekly close above roughly $68,000 keeps the long-term trend intact, a setup we noted when Bitcoin slipped below what recent buyers paid.
Market Context
Bitcoin
BTC
$67,630
-1.83% (24H)
Market Cap
$1.36T
24H Volume
$27.9B
24H High
$70,242
Article Intelligence
Key Entities
Topics
Related Coverage
 CryptoWeekend Liquidity Trap - What Most Traders Miss for BINANCE:BTCUSDT by DomicChainaan hour ago · 1 min read
 CryptoBitcoin Falls Below $68,00036 minutes ago · 1 min read
 CryptoStrategy says Bitcoin can upgrade to resist fut...an hour ago · 1 min read
Sponsored
Ad
NewsLayerLearn more
NewsLayer Premium
Unlock deeper intelligence.
Ad-free reading, exclusive research, and real-time onchain insights.
Go Premium