
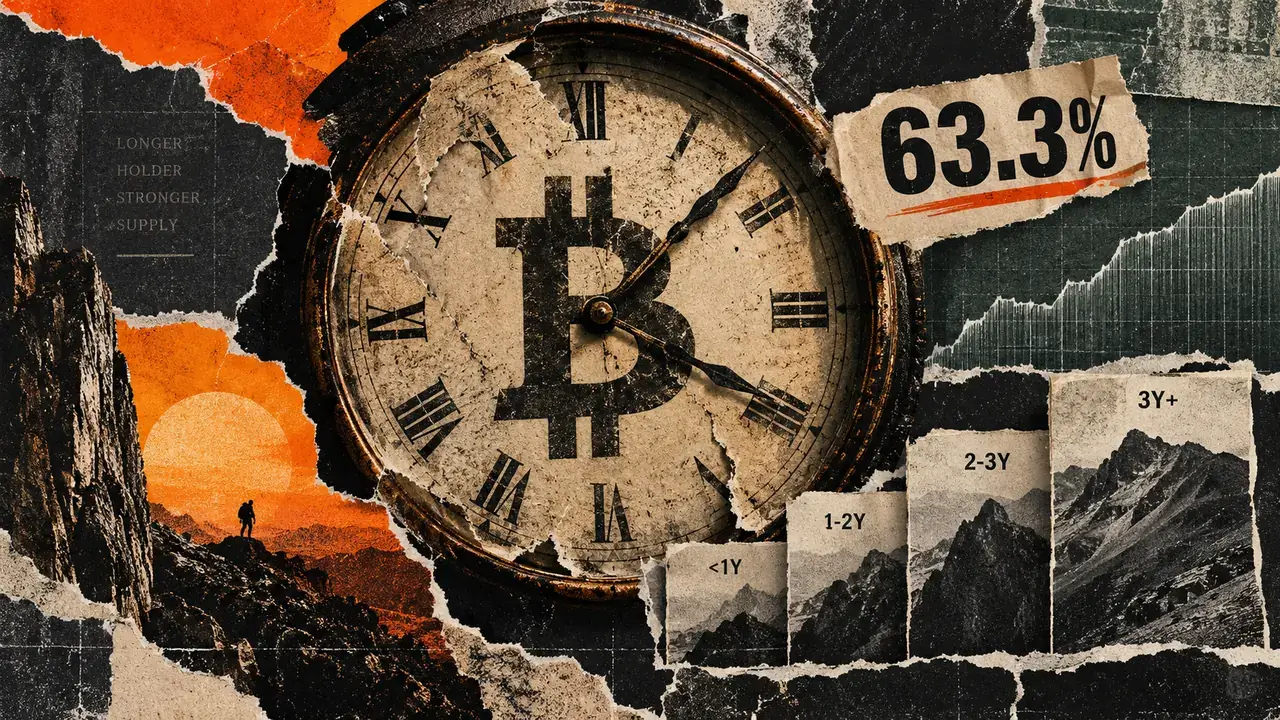
Bitcoin’s share of supply last moved at least one year ago reached 63.3% on Sept. 18, up 0.98 percentage points from 62.32% on Aug. 18, according to Maketo’s HODL-wave data.
Why Bitcoin’s 63% HODL wave isn’t the mega bull signal everyone thinks it is
Bitcoin’s share of supply last moved at least one year ago reached 63.3% on Sept. 18, up 0.98 percentage points from 62.32% on Aug. 18, according to Maketo’s HODL-wave data.
cryptoslate.com
Publisher
Sep 20, 2026 at 6:30 AM UTC · 2 dk okuma
Entities
bitcoin
Market Impact
BTC+1.64%$81,606
Last Updated
bir gün önce
Çevriliyor…
HODL waves group Bitcoin’s unspent transaction outputs into age bands based on their last on-chain movement. The rising one-year share therefore shows that more supply now sits in older bands. Current-month buying and deliberate withdrawal from the market require separate evidence.
The underlying bands point to a specific mechanism. Coins that last moved roughly a year ago can enter the one-to-two-year bracket simply by remaining still long enough to cross the boundary.
What Bitcoin HODL waves measure
The one-to-two-year band increased to 14.57% of supply from 13.52% between Aug. 18 and Sept. 18, a gain of 1.05 percentage points. That was the largest positive change among the cohorts already older than one year.
Over the same period, the six-to-twelve-month band fell to 17.53% from 19.10%. Glassnode’s Sept. 18 snapshot showed the same latest values for both bands.
The paired moves are consistent with coins crossing the one-year boundary. Each band is a net share after coins age into it, age out of it or move on-chain and reset to the youngest cohort, leaving the identity and gross flow of the underlying units unresolved.
Market Context
Bitcoin
BTC
$81,610
+1.65% (24H)
Market Cap
$1.64T
24H Volume
$18.2B
24H High
$82,074
Article Intelligence
Key Entities
Related Coverage
:quality(82)/c1075ff28cfe40449a3e6e6bca977819) CryptoIs Bitcoin's Bear Market Low In? A Signal Absent for 45 Weeks Returns2 saat önce · 1 min read
CryptoIs Bitcoin's Bear Market Low In? A Signal Absent for 45 Weeks Returns2 saat önce · 1 min read MarketsBitcoin reclaims 50-week moving average: Is the bear market over?2 saat önce · 3 min read
 CryptoBTC, ETH and XRP Push High as Short Squeeze Lifts Crypto21 dakika önce · 4 min read
Sponsored
Ad
NewsLayerLearn more
NewsLayer Premium
Unlock deeper intelligence.
Ad-free reading, exclusive research, and real-time onchain insights.
Go Premium