


XRP Price on the Edge of $1: Why the Next Bitcoin Drop Could Crash XRP to $0.80
$1 is the last structural support XRP has left before a long air pocket down to $0.90 and $0.80. It is not just a round number, it is where buyers have repeatedly stepped in since late June, and it is now the only thing separating $XRP…
CryptoTicker
Publisher
Aug 16, 2026 at 2:33 PM UTC · 6 phút đọc

Entities
bitcoin, xrp
Market Impact
Total MCap+5.54%
Last Updated
4 ngày trước
Đang dịch…
$1 is the last structural support XRP has left before a long air pocket down to $0.90 and $0.80. It is not just a round number, it is where buyers have repeatedly stepped in since late June, and it is now the only thing separating $XRP from levels it has not traded at in almost two years.
Round numbers matter in crypto because they concentrate orders. Stop losses cluster just beneath them, limit buys stack just above them, and derivatives desks build positions around them. XRP has spent roughly two months grinding sideways against this line, which means an enormous amount of leverage has been built directly on top of it.
When that kind of level breaks with conviction rather than in a wick, the resulting move is rarely orderly. The stops trigger, the liquidations cascade, and the price does not stop at the first sign of demand. It stops where the next real bid sits.
What do the charts actually say about XRP right now?
XRP is trading below its 200-week EMA at $1.3745, its weekly RSI has fallen to 31.02 against a signal line at 33.50, and the entire structure since March has been a clean series of lower highs and lower lows.
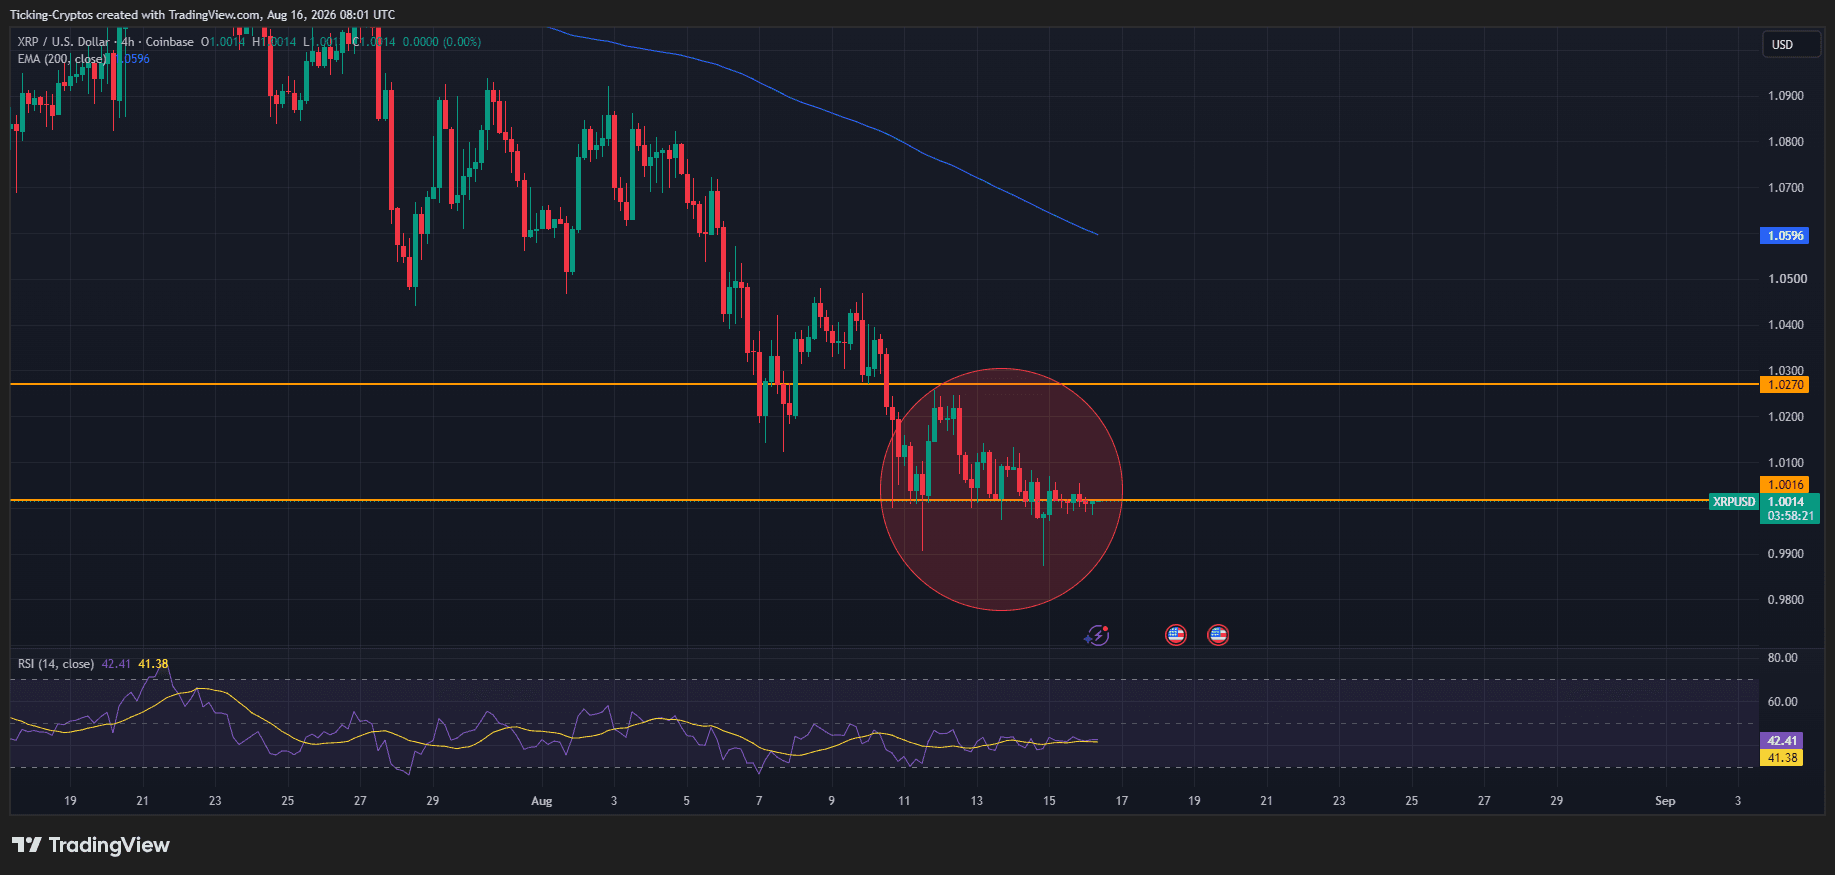
Break that down:
- The 200 EMA at $1.3745 is now overhead resistance, not support. XRP lost it in May and every attempt to reclaim it since has been rejected. Until price closes back above it, the weekly trend is bearish by definition.
- Weekly RSI at 31.02 is nearly oversold, but on a weekly timeframe that is not automatically bullish. Oversold in a downtrend usually means the trend is working, not that a reversal is due. RSI can sit in the low 30s for months.
- RSI below its signal line means momentum is still deteriorating, not stabilising.
- The rejection map above is brutal: $1.20, $1.30, the EMA at $1.3745, then $1.50 and $1.80. Every single one of those was support on the way down. They are all resistance now.
Market Context
Article Intelligence
Related Coverage
 CryptoXRP Notches Best Week Since 2024 Election Pump on Bitcoin Short Squeeze3 giờ trước · 3 min read
 CryptoBitcoin and Ether ETFs attract $706M as crypto prices surge above key levels.37 phút trước · 1 min read
 CryptoBitcoin’s $73K push may hinge on ETF demand: Analysts44 phút trước · 1 min read
Sponsored
Ad
NewsLayerLearn more
NewsLayer Premium
Unlock deeper intelligence.
Ad-free reading, exclusive research, and real-time onchain insights.
Go Premium