This website uses cookies
We use cookies to personalise content and ads, to provide social media features and to analyse our traffic. We also share information about your use of our site with our social media, advertising and analytics partners who may combine it with other information that you’ve provided to them or that they’ve collected from your use of their services.
Consent Selection
Details
  • Necessary cookies help make a website usable by enabling basic functions like page navigation and access to secure areas of the website. The website cannot function properly without these cookies.
  • Preference cookies enable a website to remember information that changes the way the website behaves or looks, like your preferred language or the region that you are in.
    • We do not use cookies of this type.

  • Statistic cookies help website owners to understand how visitors interact with websites by collecting and reporting information anonymously.
    • We do not use cookies of this type.

  • Marketing cookies are used to track visitors across websites. The intention is to display ads that are relevant and engaging for the individual user and thereby more valuable for publishers and third party advertisers.
    • We do not use cookies of this type.

  • Unclassified cookies are cookies that we are in the process of classifying, together with the providers of individual cookies.
    • __emg_sidPending
      Maximum Storage Duration: 1 dayType: HTTP Cookie
      __emg_vidPending
      Maximum Storage Duration: 1 yearType: HTTP Cookie
      nl-read-countPending
      Maximum Storage Duration: PersistentType: HTML Local Storage
Cookie declaration last updated on 8/12/26 by Cookiebot
[#IABV2_TITLE#]
[#IABV2_BODY_INTRO#]
[#IABV2_BODY_LEGITIMATE_INTEREST_INTRO#]
[#IABV2_BODY_PREFERENCE_INTRO#]
[#IABV2_BODY_PURPOSES_INTRO#]
[#IABV2_BODY_PURPOSES#]
[#IABV2_BODY_FEATURES_INTRO#]
[#IABV2_BODY_FEATURES#]
[#IABV2_BODY_PARTNERS_INTRO#]
[#IABV2_BODY_PARTNERS#]
About
Cookies are small text files that can be used by websites to make a user's experience more efficient.

The law states that we can store cookies on your device if they are strictly necessary for the operation of this site. For all other types of cookies we need your permission.

This site uses different types of cookies. Some cookies are placed by third party services that appear on our pages.

You can at any time change or withdraw your consent from the Cookie Declaration on our website.

Learn more about who we are, how you can contact us and how we process personal data in our Privacy Policy.

Please state your consent ID and date when you contact us regarding your consent.
NewsLayer

Install NewsLayer

Get the app experience — one tap from your home screen, instant loads and breaking-news alerts.

NewsLayer.com
External ReportingVeröffentlicht vor einer Stunde

Bitcoin keeps failing at $65K: is a drop to $62.8K coming next?

Bitcoin price is trading near $63,000 after repeated failures above $65,000, with US spot Bitcoin ETF outflows and weakening short-term price action keeping $BTC under pressure.

Bitcoin keeps failing at $65K: is a drop to $62.8K coming next?
Publisher Cryptonews.net 4 Min. Lesezeit
Image via Cryptonews.net

Market Context

Bitcoin

BTC

$62,879

-0.86% 24h

Layer Index

↓ 7 pts in 24h

Bitcoin price is trading near $63,000 after repeated failures above $65,000, with US spot Bitcoin ETF outflows and weakening short-term price action keeping $BTC under pressure.

According to SoSoValue data, US spot Bitcoin ETFs recorded about $131 million in net outflows on August 13, extending a run of withdrawals that has reduced one of Bitcoin's main sources of buying demand in recent sessions.

ARK 21Shares' ARKB led the latest withdrawals with roughly $58.8 million in net outflows. A day earlier, the funds lost another $61.1 million, including about $46.8 million from Fidelity's FBTC.

The selling followed an uneven start to the week. Spot Bitcoin ETFs posted $144.6 million in net outflows on August 10, followed by just $7.8 million of inflows on August 11 before withdrawals resumed over the next two sessions.

With ETF demand weakening, Bitcoin has struggled to hold its recent highs. CoinGecko data showed $BTC trading around $63,173 on August 14, down about 1.6% over the past seven days.

Price action over the same period shows $BTC trading above $65,000 several times between August 8 and August 10 before the market turned lower.

Bitcoin lost $64,500 on August 11, and subsequent rebounds have repeatedly stalled below $64,500, leaving the price close to $63,000.

US inflation data provided some relief but failed to reverse the decline. July headline inflation eased to 3.4% from 3.5%, while core inflation fell to 2.5% from 2.6%.

Bitcoin initially moved higher after the release as the softer figures reduced immediate pressure on the Federal Reserve to tighten monetary policy.

The reaction faded quickly, however, and $BTC remained unable to establish itself above $64,000.

The failure left the $64,000 to $65,000 area as the main obstacle separating Bitcoin from another attempt at $65,000.

Recent price action has also kept $BTC inside the range that has largely contained it between roughly $62,000 and $66,000.

Liquidation positioning adds another level traders may have to contend with before a recovery develops.
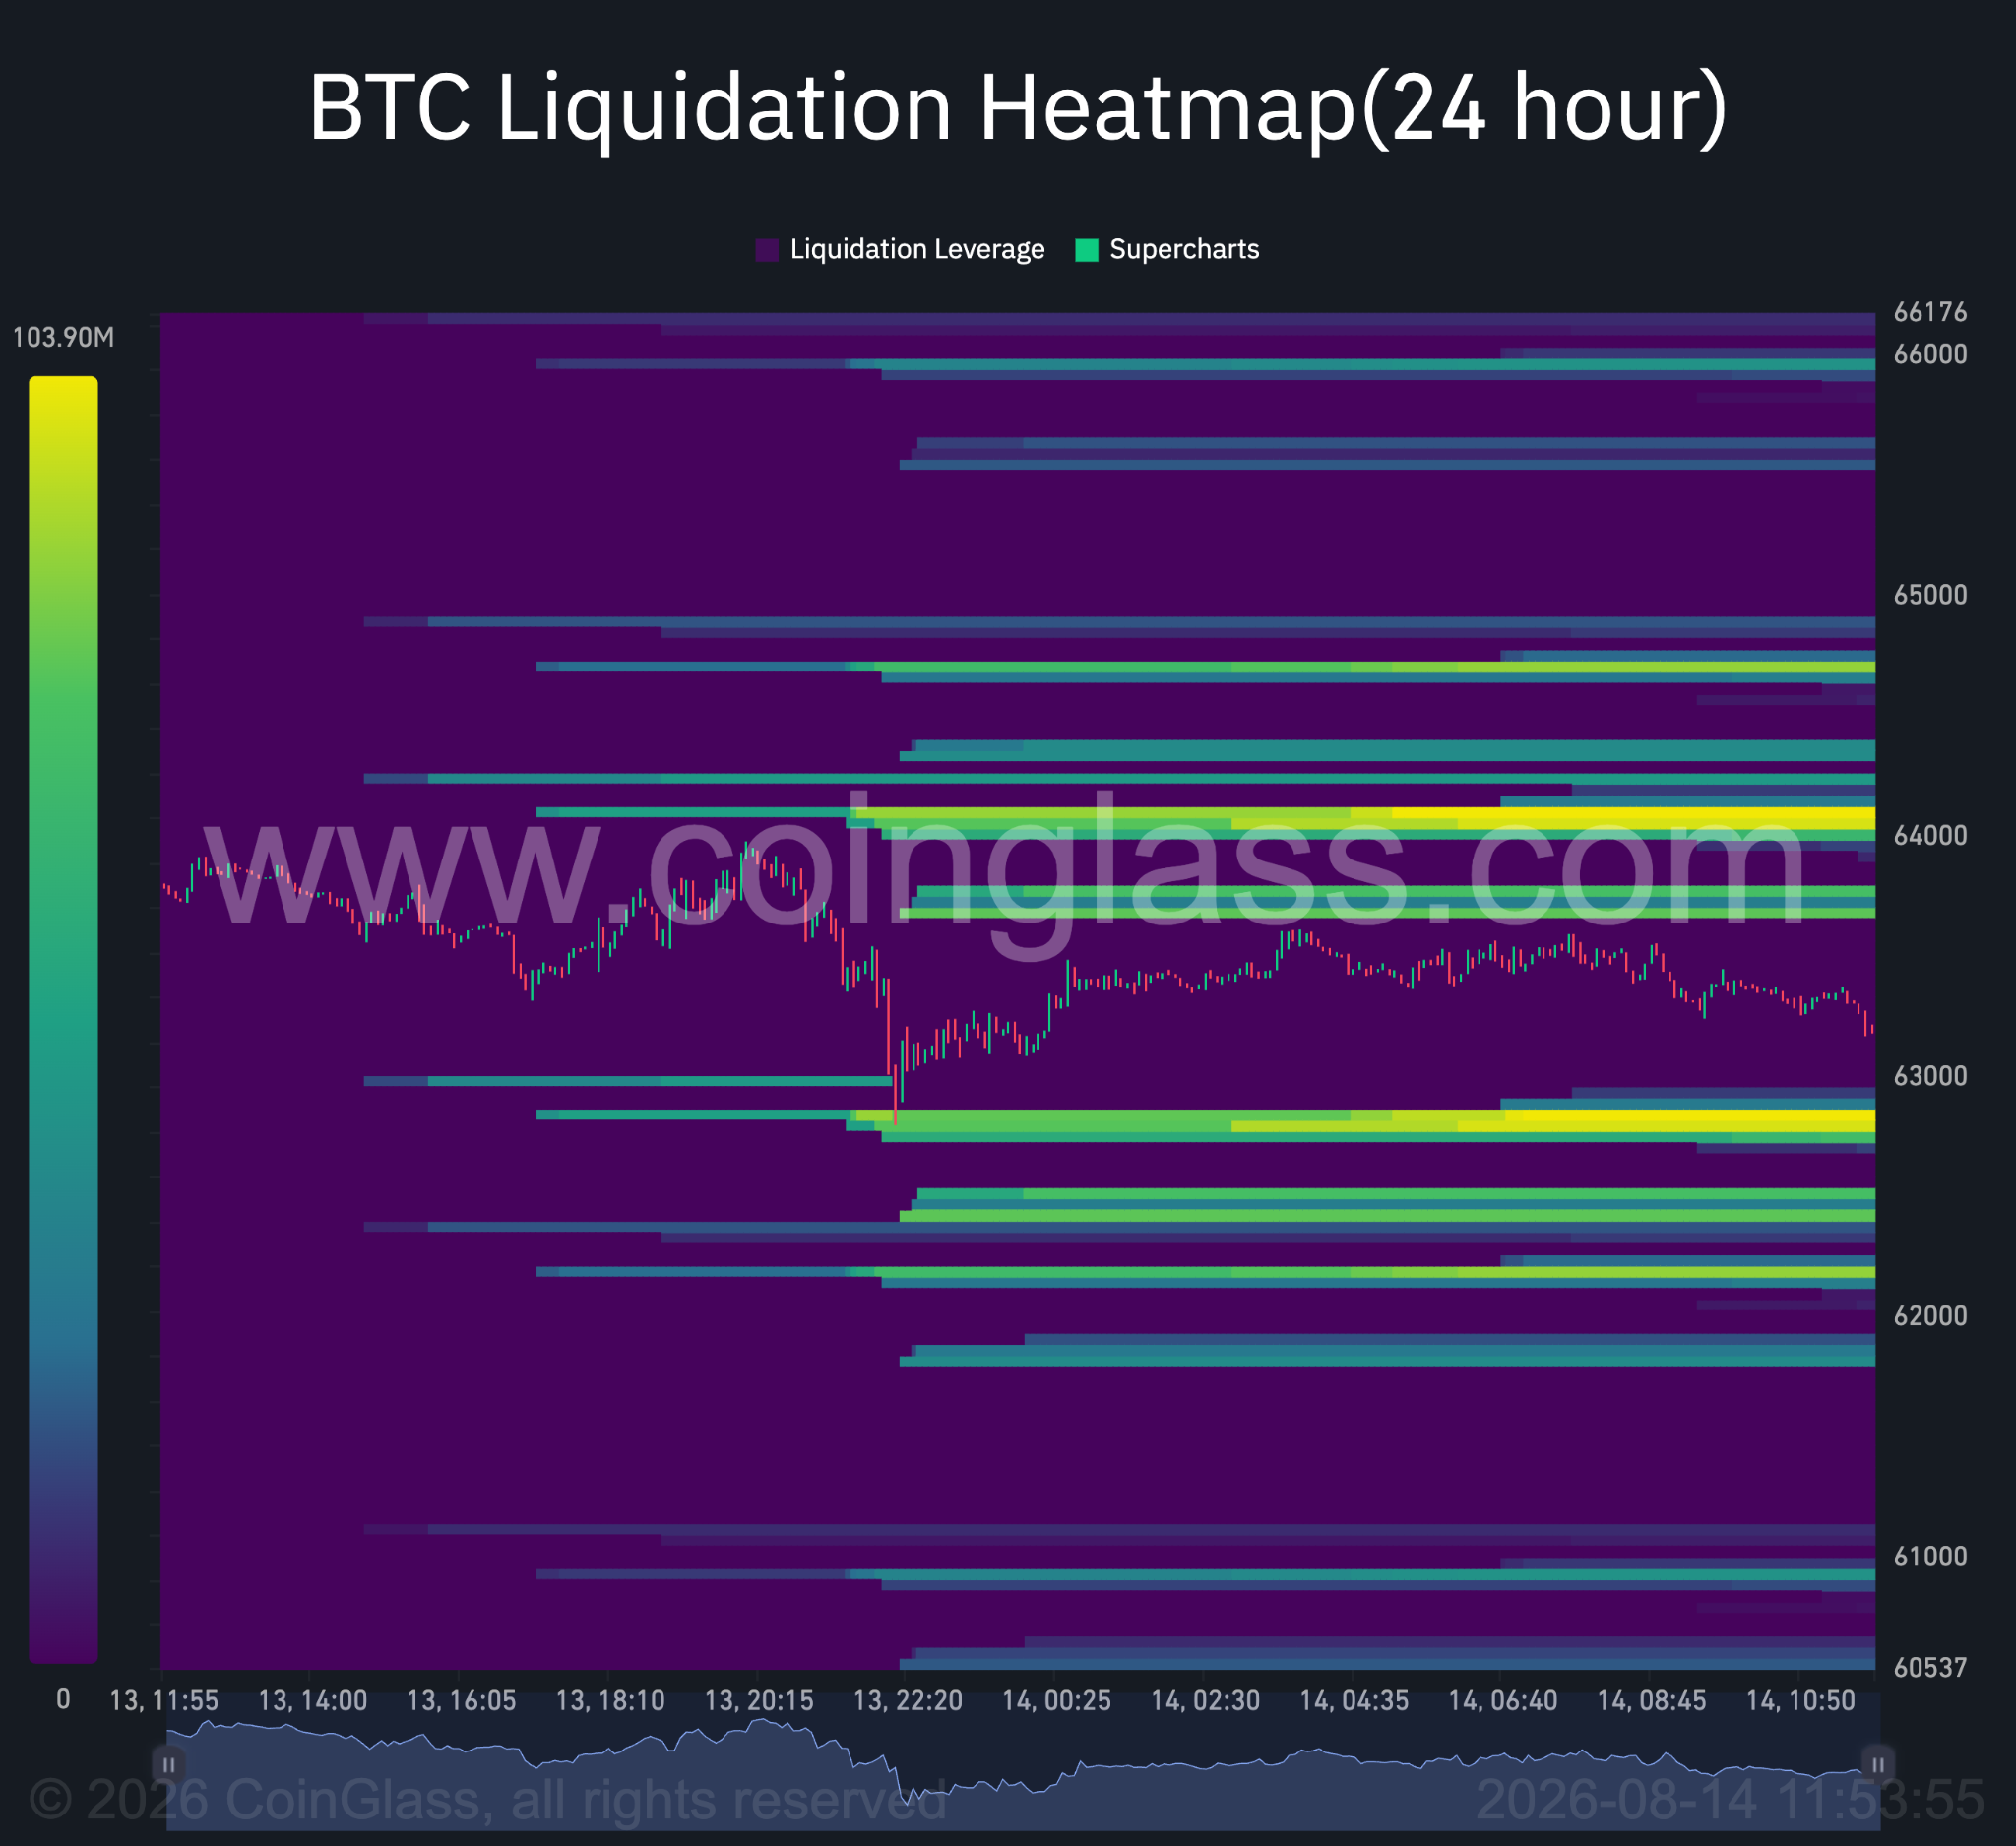
See below:

Bitcoin 24-hour liquidation heatmap. Source: Coinglass.

CoinGlass' 24-hour Bitcoin liquidation heatmap from August 14 showed a large concentration of leveraged positions around $62,750 to $62,900, just below the current price.

Another pocket sits around $62,300 to $62,500. Above spot, the heatmap shows sizeable concentrations around $63,700 to $64,050 and another strong band near $64,500 to $64,650.

The positioning leaves liquidity on both sides of $BTC, but the closest large concentration is below $63,000.

A further decline could therefore put the $62,800 area in focus before Bitcoin gets another chance to challenge the liquidity sitting above $64,000.

$BTC price analysis

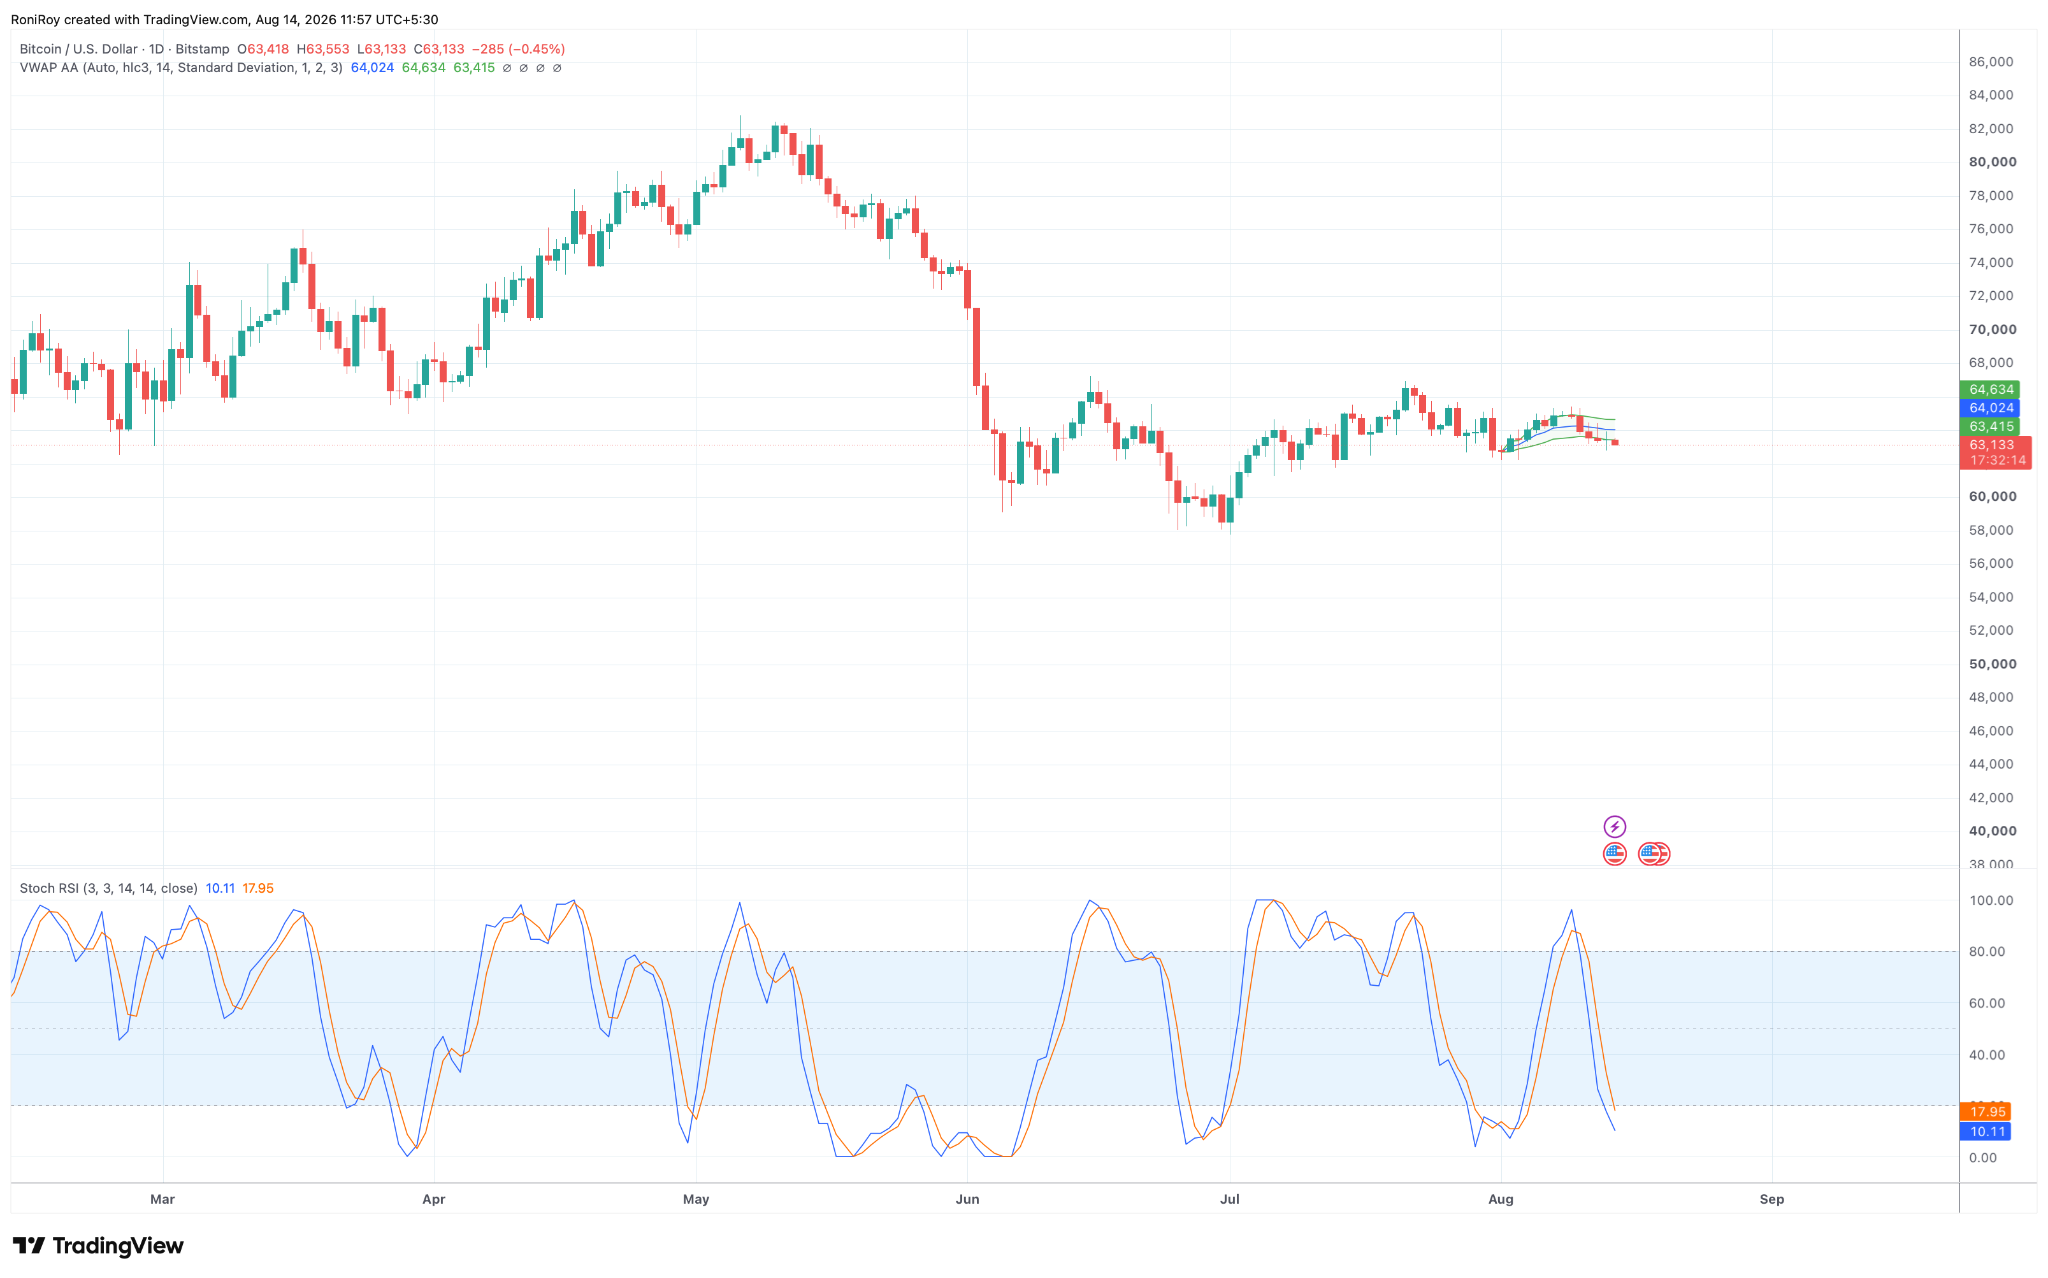
Bitcoin's daily chart shows that the path back to $65,000 remains difficult despite momentum reaching oversold levels.

On the daily TradingView chart, $BTC was trading around $63,133 on August 14 after falling below three anchored VWAP levels at approximately $63,415, $64,024 and $64,634.

$BTC/USD 1-day price chart. Source: TradingView.

With all three now above the market, Bitcoin has several resistance levels to recover before $65,000 comes back into play.

The first test sits around $63,400. A move above it would put the second anchored VWAP around $64,024 in focus, which also lines up with the heavy liquidation concentration around $63,700 to $64,050 on the CoinGlass heatmap.

Clearing that area would leave the third anchored VWAP at roughly $64,634 as the next hurdle.

The heatmap places another large liquidation cluster around $64,500 to $64,650, making that zone particularly important for any attempt to reach $65,000.

Momentum on the daily chart, however, leaves room for a rebound. The Stochastic RSI has dropped deep into oversold territory, with the %K line at 10.11 and %D at 17.95.

Such readings show that the latest decline has pushed short-term momentum toward the lower end of its recent range, although the indicator has not yet produced a confirmed bullish turn.

A recovery in the Stochastic RSI alongside a move back above the anchored VWAP levels would improve the case for another test of $65,000.

Without that price confirmation, the oversold reading alone does not establish that the decline has ended.

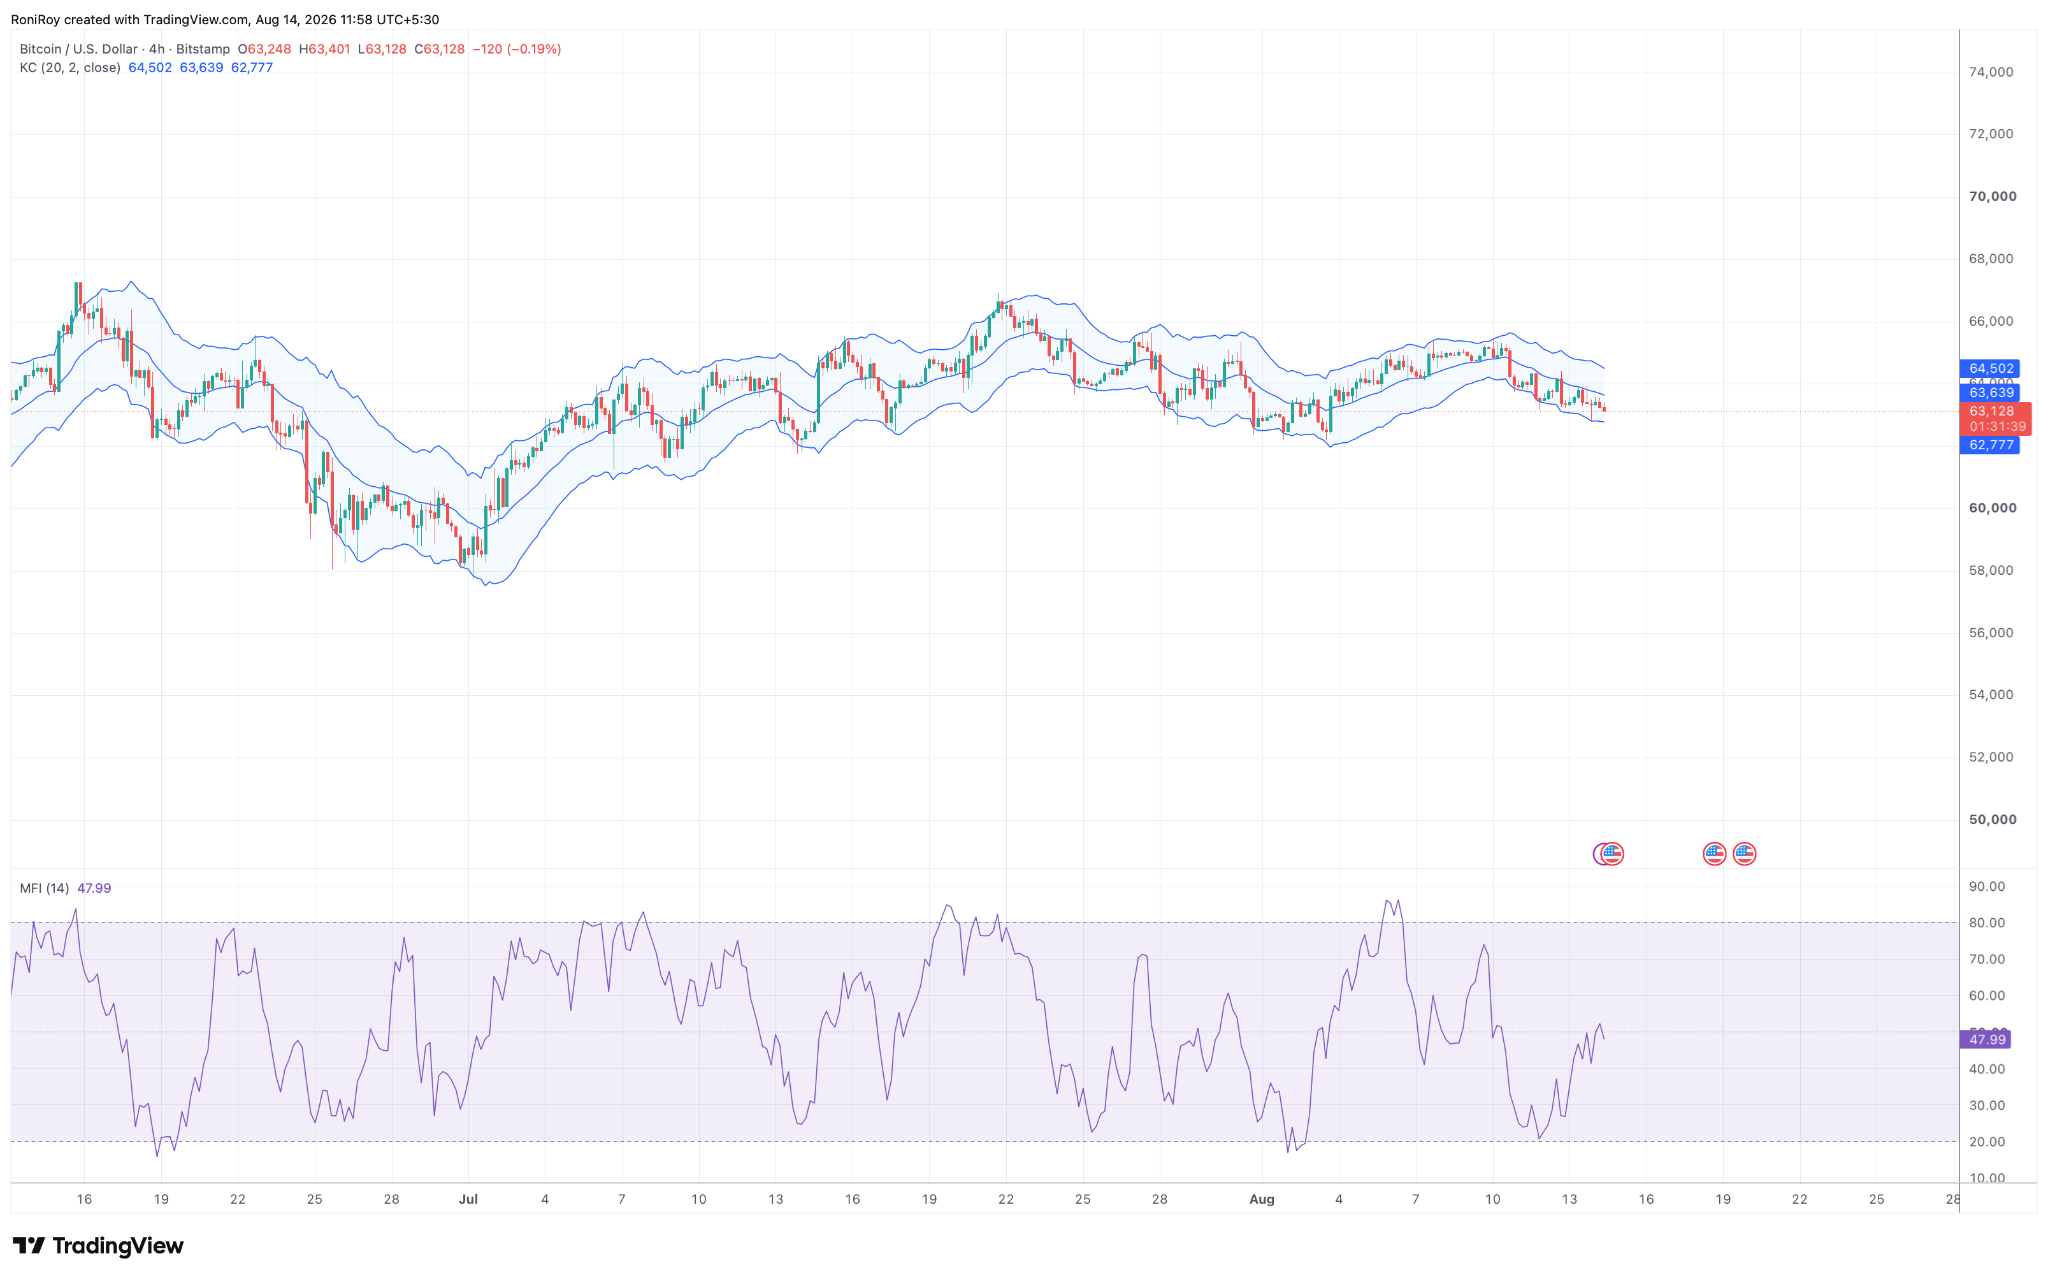
The 4-hour chart gives $62,800 added importance if selling continues.

See below:

$BTC/USD 4-hour price chart. Source: TradingView.

Bitcoin was trading around $63,128, below the Keltner Channel basis at $63,639 and not far above its lower band at $62,777. The upper Keltner band stood around $64,502.

That lower band almost overlaps with the $62,750 to $62,900 liquidation cluster shown by CoinGlass.

If $BTC loses $63,000, the combination places roughly $62,800 as the first downside target, followed by the $62,300 to $62,500 liquidity area and the larger $62,000 support zone.

The 4-hour Money Flow Index stood at 47.99, having recovered from levels close to oversold territory.

A reading near 50 shows neither strong buying nor selling pressure, leaving Bitcoin without a clear money-flow advantage as it trades near the lower half of the Keltner Channel.

For the upside, the 4-hour setup puts $63,639 at the first recovery level. Above it, the $64,000 area becomes the next test before the Keltner upper band around $64,502.

A break through $64,500 to $64,650 would clear both the upper Keltner area and one of the largest nearby liquidation clusters on the heatmap, opening a direct test of $65,000.

If buyers can establish $BTC above $65,000, the recent seven-day price action leaves the $65,500 to $66,000 region as the next area to watch.

On the downside, failure to defend the lower Keltner band around $62,777 would expose $62,500 and $62,000, with the latter sitting near the bottom of Bitcoin's recent trading range.

Eilmeldung

Verpassen Sie keine Eilmeldung

Advertisement

House — Advertise on NewsLayer
NewsLayerAd

Sourced by

Originally reported by Cryptonews.net

NewsLayer coverage based on externally reported material.

The Daily Brief

The onchain economy, before your day starts.

Curated markets, onchain insights, and key headlines — delivered every weekday morning.

Weekdays · Free · ~5 minute read

Ähnliche Artikel