
Bitcoin price faces $85,200 resistance after $87K retreat
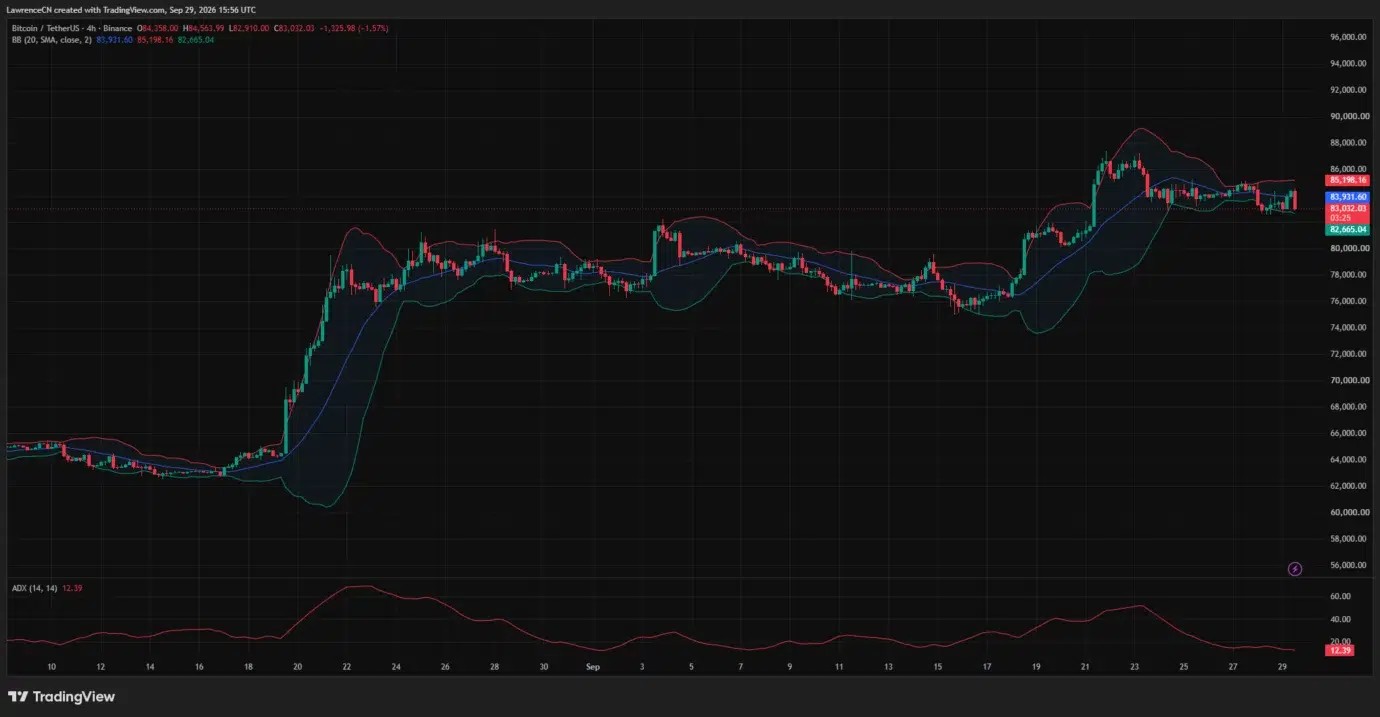
Bitcoin’s latest 4-hour candle on the TradingView chart fell from an open near $84,358 to roughly $83,032. Its low reached $82,910, bringing the price close to the lower Bollinger Band at $82,665. The middle band stood at $83,932, while…
Cryptonews.net
Publisher
Sep 29, 2026 at 7:22 PM UTC · 3 Min. Lesezeit
Key Signal
$2.39B weekly ETF net inflows
Entities
bitcoin
Market Impact
BTC+0.13%$83,829
Last Updated
vor 19 Stunden
Übersetzung…
Bitcoin’s latest 4-hour candle on the TradingView chart fell from an open near $84,358 to roughly $83,032. Its low reached $82,910, bringing the price close to the lower Bollinger Band at $82,665. The middle band stood at $83,932, while the upper band was near $85,198.
A recovery above the middle band would put $84,000 back in play before Bitcoin tests the $85,000–$85,200 area. The recent high near $87,400 would remain a further hurdle. Bitcoin’s attempts to rebound during the past several sessions have stalled below that high.
The 4-hour average directional index, or ADX, stood at 12.39. ADX measures the strength of a trend rather than its direction, and the low reading indicates that the earlier upward move has lost strength on this timeframe. Price has moved back and forth around the middle Bollinger Band since the initial drop from the weekly high, before the latest move toward the lower band.
On the daily chart, the broader moving-average structure remains above its longer-term measures. Bitcoin traded above the 20-day average at $80,944, the 50-day average at $76,883, and the 100-day average at $70,135. The 200-day average stood near $71,235.
Market Context
Bitcoin
BTC
$83,740
+0.02% (24H)
Market Cap
$1.68T
Circulating Supply
20.1M BTC
24H Volume
$35.0B
24H High
$85,604
Article Intelligence
Key Entities
Related Coverage
 CryptoBitcoin Price Prediction for October 2026vor 38 Minuten · 5 min read
 CryptoCrypto Trading API Guide: The Best APIs For Automated Trading In 2026vor einer Stunde · 9 min read
 CryptoCurrent price of Bitcoin for Sept. 30, 2026vor einer Stunde · 1 min read
Sponsored
Ad
NewsLayerLearn more
NewsLayer Premium
Unlock deeper intelligence.
Ad-free reading, exclusive research, and real-time onchain insights.
Go Premium