
Bitcoin price outlook: Where is BTC headed this October?
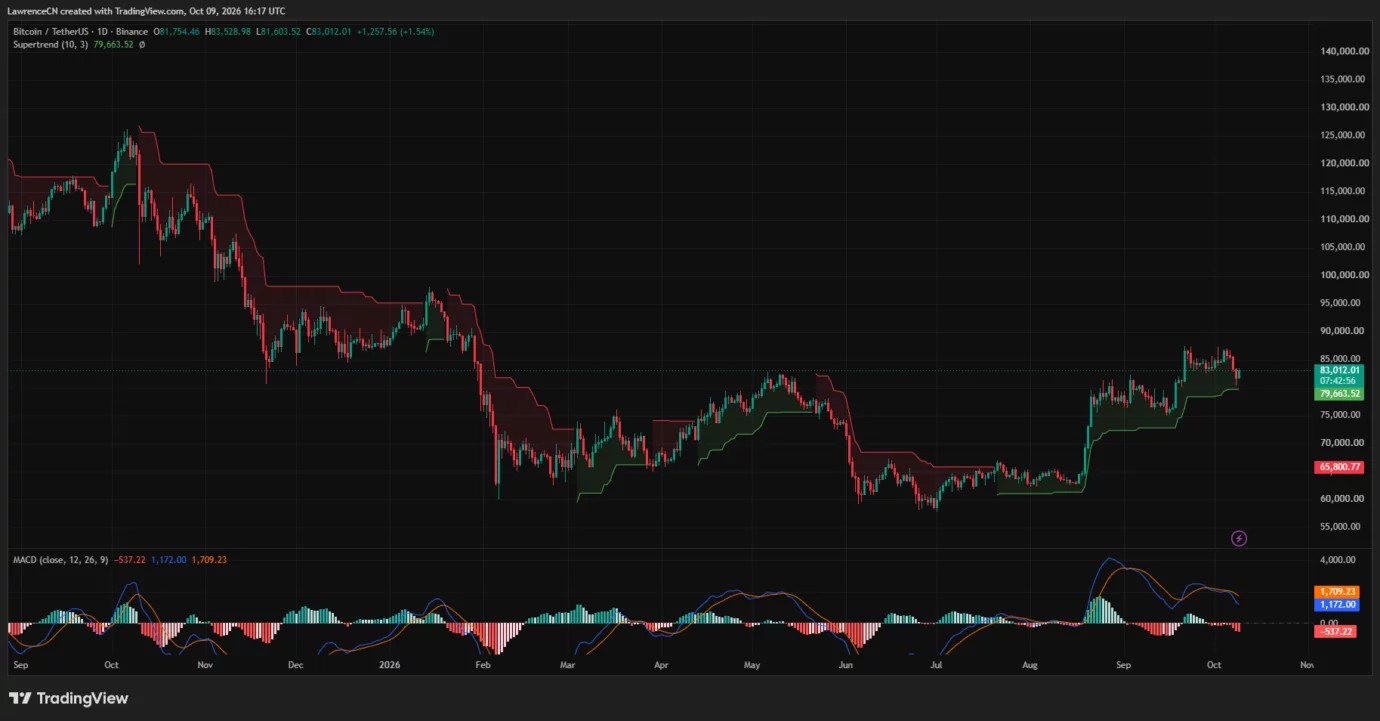
On the daily TradingView chart, Bitcoin remained above its green Supertrend line at $79,663.52. The indicator still supports a bullish trend reading, although the recent decline has brought price closer to that threshold.
Cryptonews.net
Publisher
Oct 9, 2026 at 8:51 PM UTC · 4 Min. Lesezeit
Key Signal
55,600 BTC Loss-making exchange transfers
Entities
bitcoin
Market Impact
BTC+0.24%$82,973
Last Updated
vor einem Tag
Übersetzung…
On the daily TradingView chart, Bitcoin remained above its green Supertrend line at $79,663.52. The indicator still supports a bullish trend reading, although the recent decline has brought price closer to that threshold.
Together, the Supertrend reading and the weekly low identify approximately $79,600–$80,400 as the nearest major support area. A sustained move below that range would weaken the daily recovery structure and expose the earlier trading region around $75,000–$76,000.
The daily MACD offers a more cautious signal. Its blue line stood at 1,172, below the orange signal line at 1,709.23, while the histogram registered negative 537.22.
The bearish crossover indicates that upward momentum has slowed despite Bitcoin’s rebound. Both MACD lines remained above zero, however, distinguishing the current loss of momentum from a fully negative reading across the indicator.
Based on those chart signals, another support test remains possible unless Bitcoin rebuilds momentum above the nearby resistance area. A recovery through $84,000–$85,000 would be an initial improvement, while the recent highs around $86,500–$87,000 represent the more important barrier.
Market Context
Bitcoin
BTC
$82,973
+0.24% (24H)
Market Cap
$1.67T
24H Volume
$11.4B
24H High
$83,090
Article Intelligence
Key Entities
Related Coverage
 MarketsOctober 10, 2026: BTC price on Oct 11, 2026 at 12am EDT Prediction Marketvor 2 Stunden · 1 min read
 CryptoBTC, ETH, XRP Crash Sparks Whale Accumulation as Buy Signals Appearvor einer Stunde · 2 min read
 CryptoBitcoin could reach $30 trillion market cap, ma...vor 2 Stunden · 1 min read
Sponsored
Ad
NewsLayerLearn more
NewsLayer Premium
Unlock deeper intelligence.
Ad-free reading, exclusive research, and real-time onchain insights.
Go Premium