
Stand 15. August 2026 wird der Nillion Crypto-Token bei $0.05 gehandelt und ist zwischen täglicher Unterstützung und Widerstand gefangen. Da der Fear & Greed Index bei 34 liegt, bleibt der breitere Markt risikoavers, was den Enthusiasmus für Altcoins dämpft, selbst wenn die kurzfristigen Signale konstruktiv werden.
Nillion Krypto-Analyse: Wichtige Niveaus & kurzfristiger bullischer Umschwung
Nillion Krypto-Analyse: Wichtige Niveaus & kurzfristiger bullischer Umschwung - The Cryptonomist
The Cryptonomist
Publisher
Aug 15, 2026 at 7:29 PM UTC · 7 Min. Lesezeit
Key Signal
$0.05 NIL trading price
Market Impact
BTC+2.38%$82,594
Last Updated
vor 2 Monaten
Wichtige Erkenntnisse
- NIL wird bei $0.05 gehandelt und befindet sich exakt an seinem täglichen Pivot-Punkt, wobei sowohl bullishe als auch bearishe Pfade offen stehen.
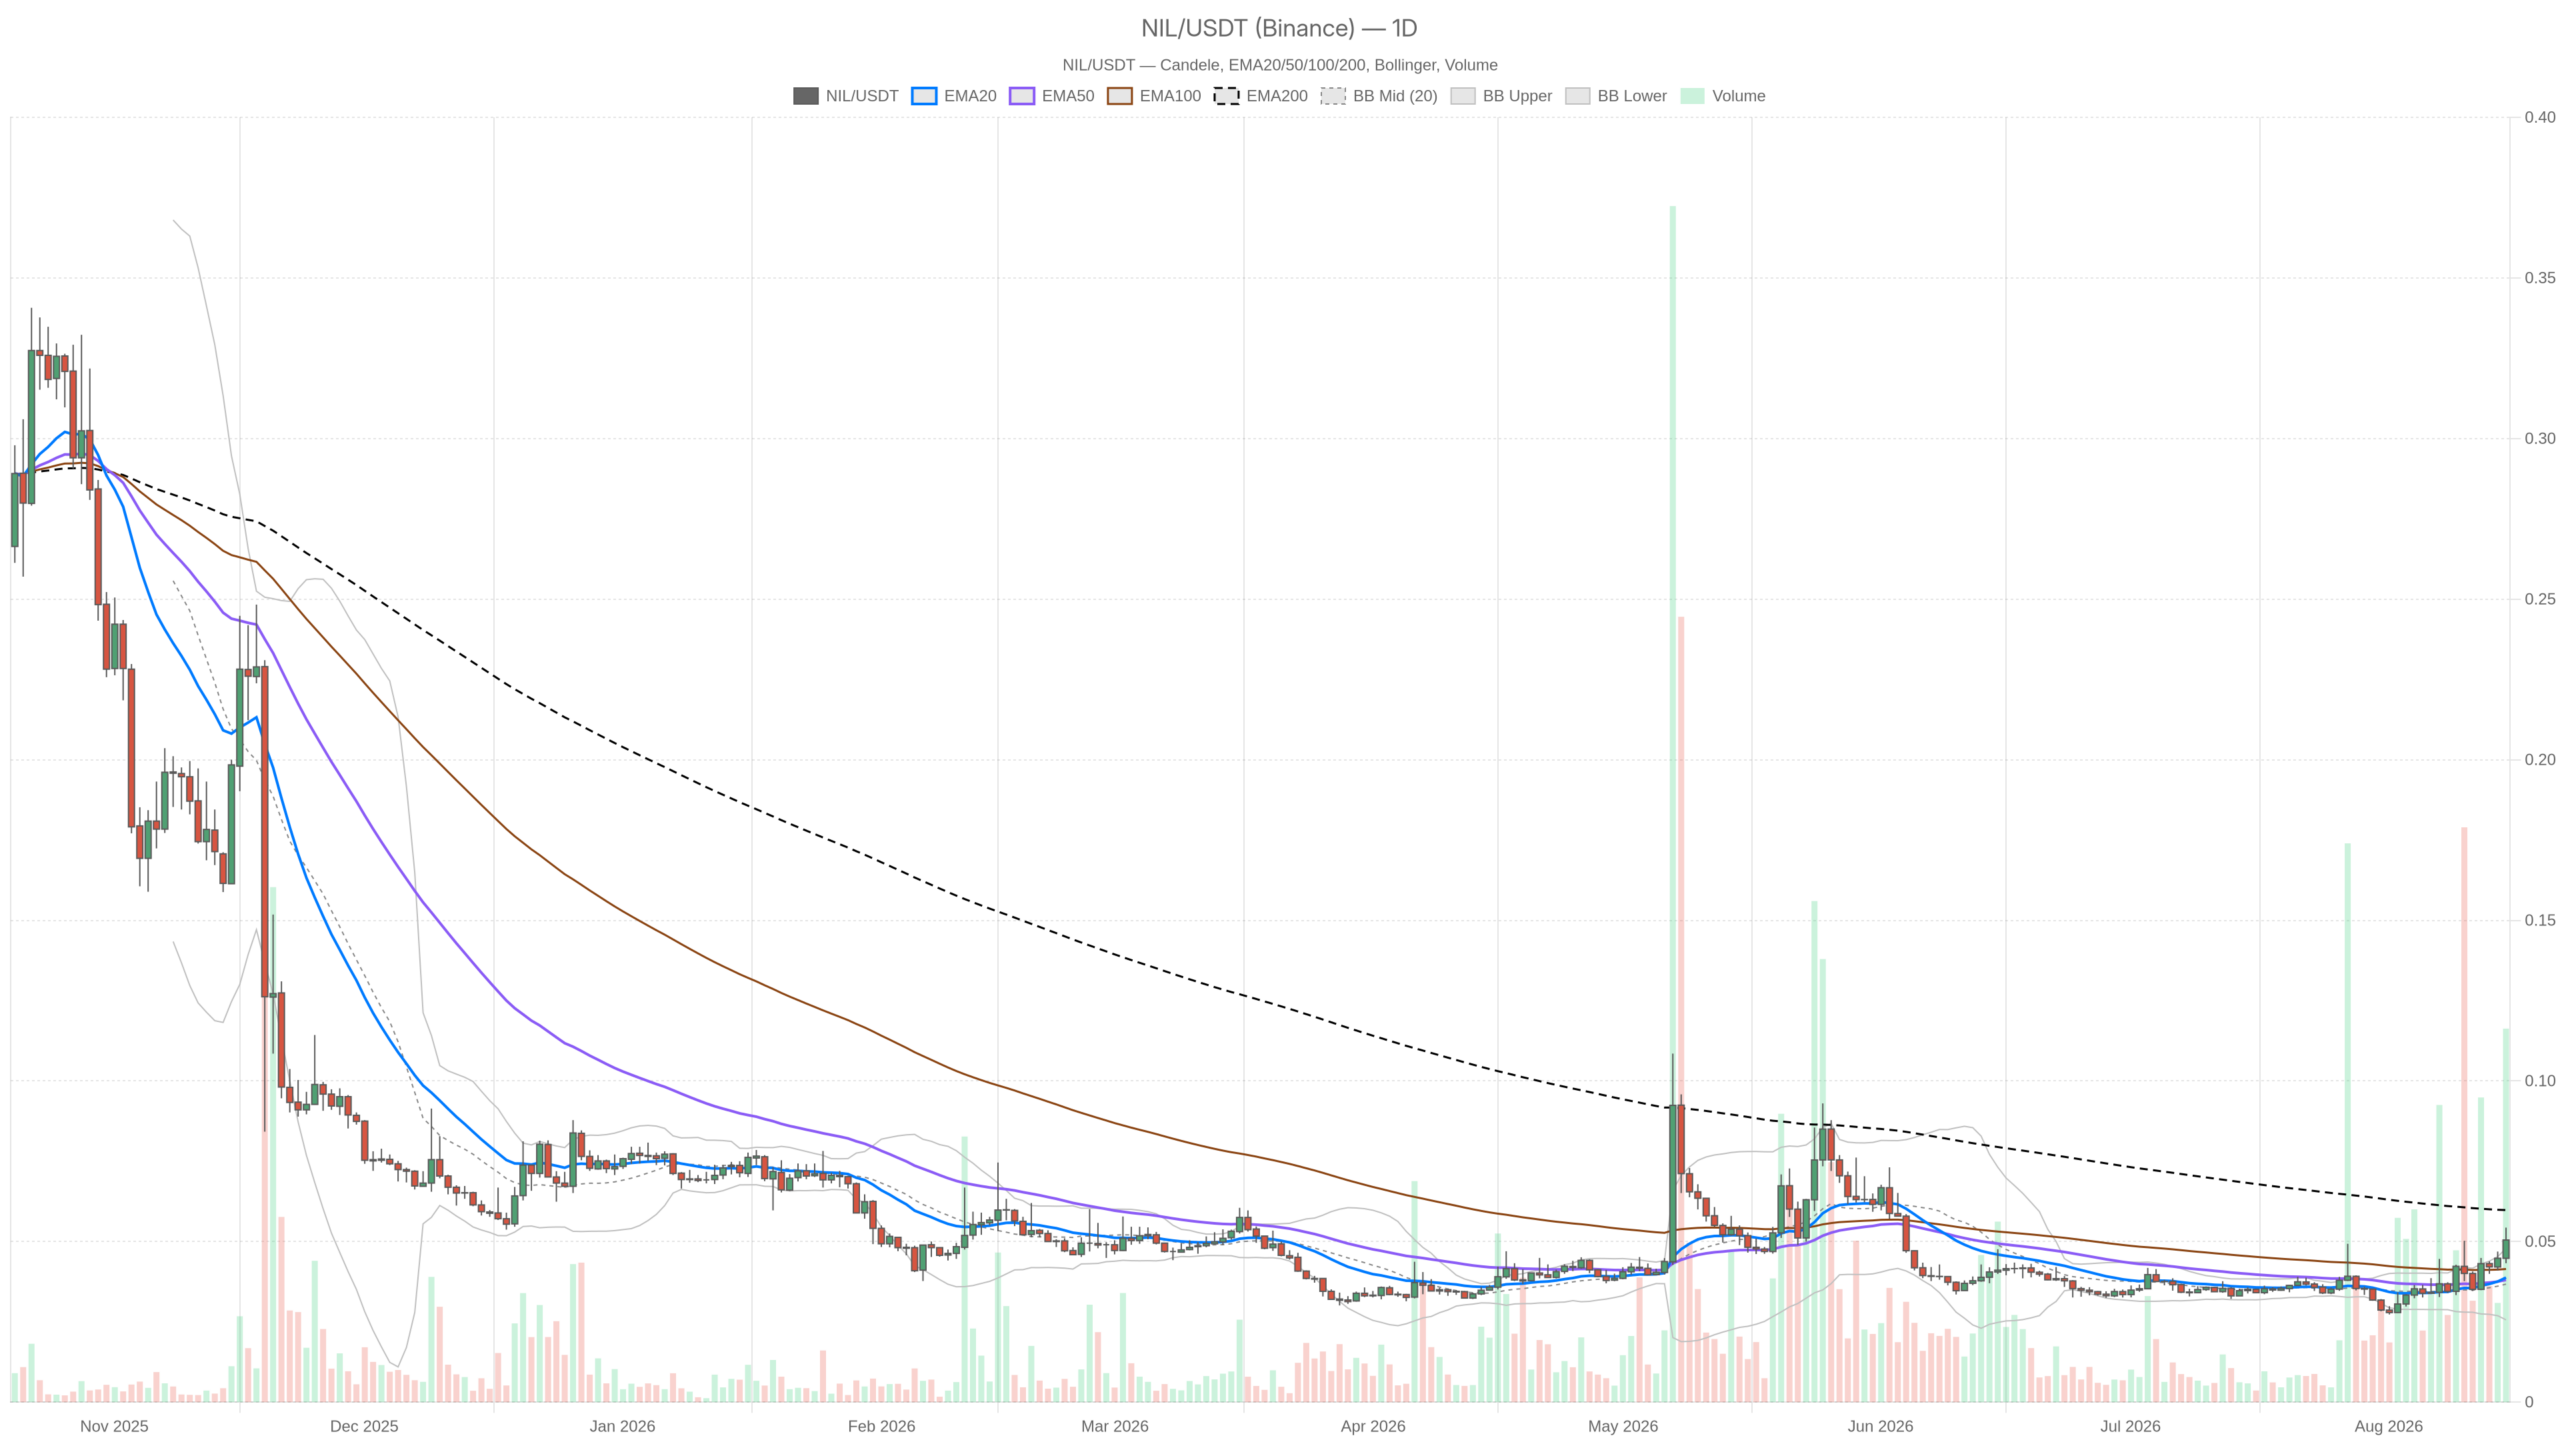
- Der Tageschart zeigt eine neutrale Struktur, wobei der RSI bei 66.58 fast überkauft ist und der Preis gegen das obere Bollinger-Band gestreckt ist.
- Die Stunden- und 15-Minuten-Zeitrahmen bleiben bullish, mit RSI-Werten über 57 und engen EMA-Stacks, die fortgesetzte Käufe unterstützen.
- Der Fear & Greed Index bei 34 und die Bitcoin-Dominanz bei 56.12% erzeugen makroökonomischen Gegenwind für Altcoin-Ausbrüche.
- Die Spanne von $0.04–$0.06 ist die Entscheidungszone, in der der nächste bedeutende Trend bestimmt wird.
Tagesstruktur: neutrales Label, bearisher Unterton
Der Tageschart für NIL zeichnet ein neutrales Bild mit bearishen Untertönen, da der Preis trotz des Verbleibs über den kurzfristigeren gleitenden Durchschnitten unter dem 200-Perioden-EMA bleibt. NIL schloss bei $0.05, oberhalb seines 20-Perioden-EMA und 50-Perioden-EMA — beide bei $0.04 — aber immer noch unter dem 200-Perioden-EMA bei $0.06. Bis der Preis diese Zone zurückerobert, wäre es verfrüht, dies als echte Trendwende zu bezeichnen.
Market Context
Bitcoin
BTC
$82,579
+2.36% (24H)
Market Cap
$1.66T
24H Volume
$22.9B
24H High
$83,463
Article Intelligence
Key Entities
UniswapFluid
Sponsored
Ad
NewsLayerLearn more
NewsLayer Premium
Unlock deeper intelligence.
Ad-free reading, exclusive research, and real-time onchain insights.
Go Premium