
Bitcoin mantiene la MA; ETH y XRP enfrentan resistencia
Bitcoin mantiene la MA; ETH y XRP enfrentan resistencia TradingPedia
TradingPedia
Publisher
Aug 19, 2026 at 6:26 AM UTC · 4 min de lectura
Key Signal
$64,391 Bitcoin Wednesday price
Entities
bitcoin, ethereum, xrp
Market Impact
Total MCap+0.66%
Last Updated
hace 2 meses
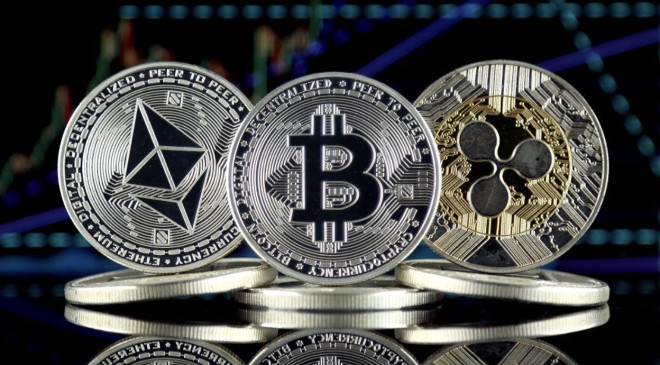
- Bitcoin cotiza cerca de $64,391 el miércoles, manteniéndose por encima de su EMA de 50 días en $64,376 pero aún por debajo de la EMA de 100 días y de la resistencia horizontal clave.
- Ethereum cambia de manos alrededor de $1,909, manteniéndose por encima de su EMA de 50 días en $1,871 mientras lucha con la resistencia en la EMA de 100 días en $1,918 y el nivel de $2,000.
- XRP cotiza cerca de $0.99, por debajo de las tres EMAs principales, mientras que la acción del precio alrededor del nivel psicológico de $1.00 señala un trasfondo técnico frágil.
Bitcoin: La recuperación enfrenta densas barreras superiores
Bitcoin (BTC) ha mostrado señales tempranas de estabilización, cotizando alrededor de $63,400 el miércoles después de ganar un 2.9% y cerrar por encima de la resistencia clave a principios de esta semana. Más tarde el miércoles, BTC cotiza a $64,391, manteniéndose justo por encima de la Media Móvil Exponencial (EMA) de 50 días en $64,376, pero la acción del precio sigue limitada por una densa zona de resistencia superior.
BTC continúa cotizando por debajo de la EMA de 100 días en $66,334 y del nivel de resistencia horizontal en $66,500, manteniendo la perspectiva a corto plazo cautelosamente bajista a pesar de la mejora en las lecturas de impulso.
Market Context
Bitcoin
BTC
$85,114
+0.32% (24H)
Market Cap
$1.71T
24H Volume
$12.6B
24H High
$85,407
Article Intelligence
Related Coverage
 CryptoEthereum ETFs Outpace Bitcoin ETFs in 2026 Inflowshace 4 horas · 3 min read
 CryptoVanEck’s ‘North Star’ For Bitcoin Points To $500,000 Price Targethace una hora · 3 min read
 CryptoXRP price at Oct 4, 2026 at 10am EDT Crypto Prediction Markethace 2 horas · 1 min read
Sponsored
Ad
NewsLayerLearn more
NewsLayer Premium
Unlock deeper intelligence.
Ad-free reading, exclusive research, and real-time onchain insights.
Go Premium