
The Bitcoin price prediction right now comes down to a single chart level, with $BTC trading at $62,983 directly on the lower boundary of an ascending channel that’s held every pullback since June, and $52,000 as the target if that boundary fails.
Bitcoin Price Prediction: Will BTC Hold Its Last Support or Flush to $52,000 Before FOMC
The Bitcoin price prediction right now comes down to a single chart level, with $BTC trading at $62,983 directly on the lower boundary of an ascending channel that’s held every pullback since June, and $52,000 as the target if that…
Cryptonews.net
Publisher
Aug 15, 2026 at 1:09 PM UTC · 4 min de lectura

Entities
bitcoin
Market Impact
BTC-1.54%$84,175
Last Updated
hace 2 meses
Traduciendo…
$BTC Price Analysis: Channel Floor or $52,000 — That Is the Only Question Right Now
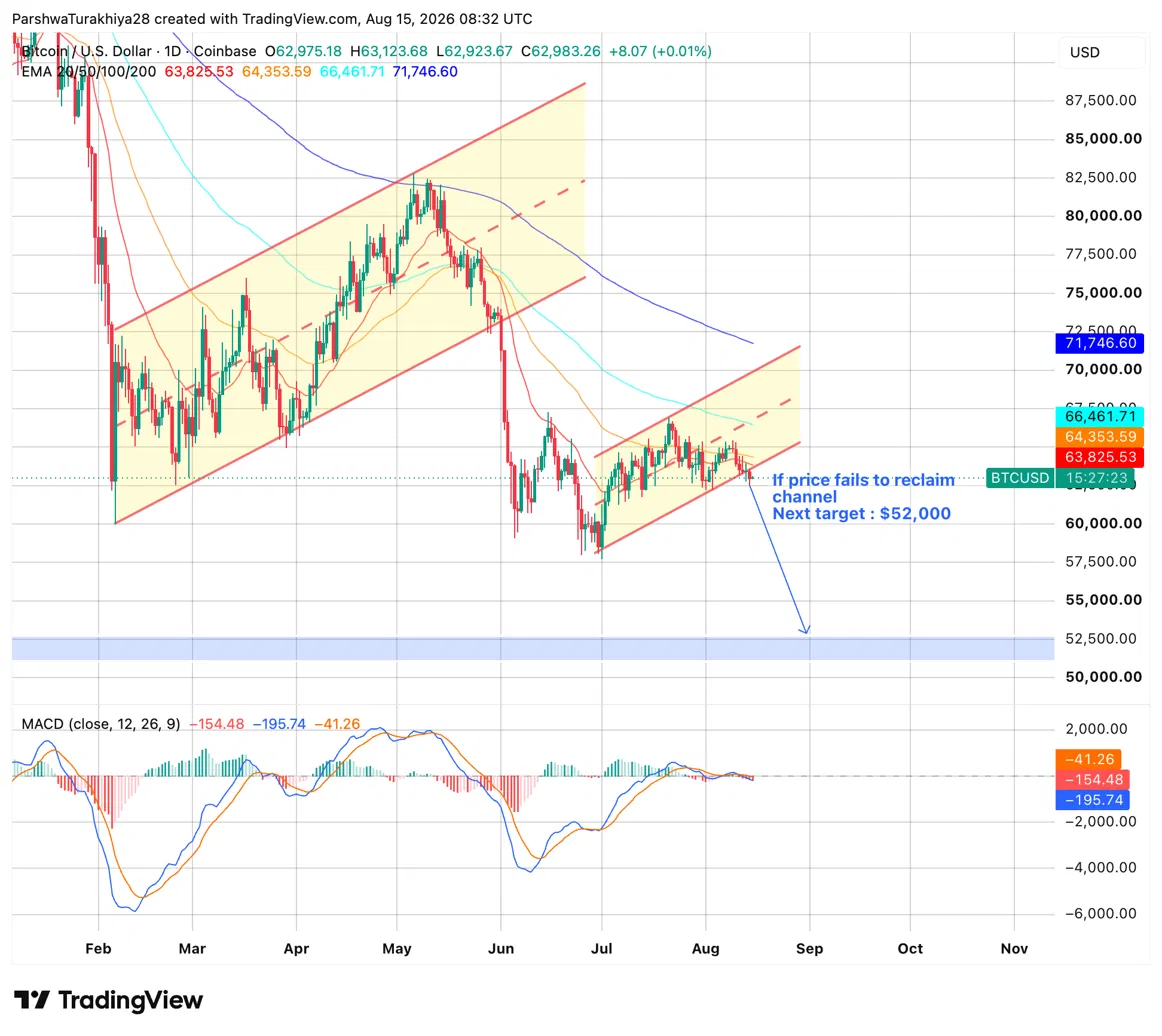
The daily chart shows $BTC pressing the lower trendline of an ascending channel that formed from the June lows near $57,500. The channel has contained every pullback since July, but price is now sitting directly on the lower boundary for the second consecutive session. The chart annotation is direct: if price fails to reclaim the channel, the next target is $52,000.
Today’s session opened at $62,975, pushed briefly to $63,124, and settled at $62,983, well below all four EMAs. The 20-day at $63,826 is the immediate ceiling, followed by the 50-day at $64,354, the 100-day at $66,462, and the 200-day at $71,747. The MACD at -154.48 remains below the signal line at -195.74 with the histogram at -41.26 still negative, meaning momentum has not turned. There is no bullish indicator on this chart right now. Every signal points to sellers being in control and the channel being the only thing preventing a larger move lower.
Market Context
Bitcoin
BTC
$84,194
-1.52% (24H)
Market Cap
$1.69T
24H Volume
$23.6B
24H High
$86,683
Article Intelligence
Key Entities
Related Coverage
 CryptoTop 3 Price Prediction: Bitcoin, Ethereum, Ripple – BTC fails to hold $85,000, ETH downside risks rise, XRP momentum fadeshace 17 minutos · 1 min read
 CryptoBitcoin plunged nearly $2,000 in 20 minutes, triggering the liquidation of approximately $400 million in long positions.hace 33 minutos · 1 min read
 CryptoBitcoin long positions worth $45.71M liquidated as price drops 1% in one hourhace 33 minutos · 1 min read
Sponsored
Ad
NewsLayerLearn more
NewsLayer Premium
Unlock deeper intelligence.
Ad-free reading, exclusive research, and real-time onchain insights.
Go Premium