
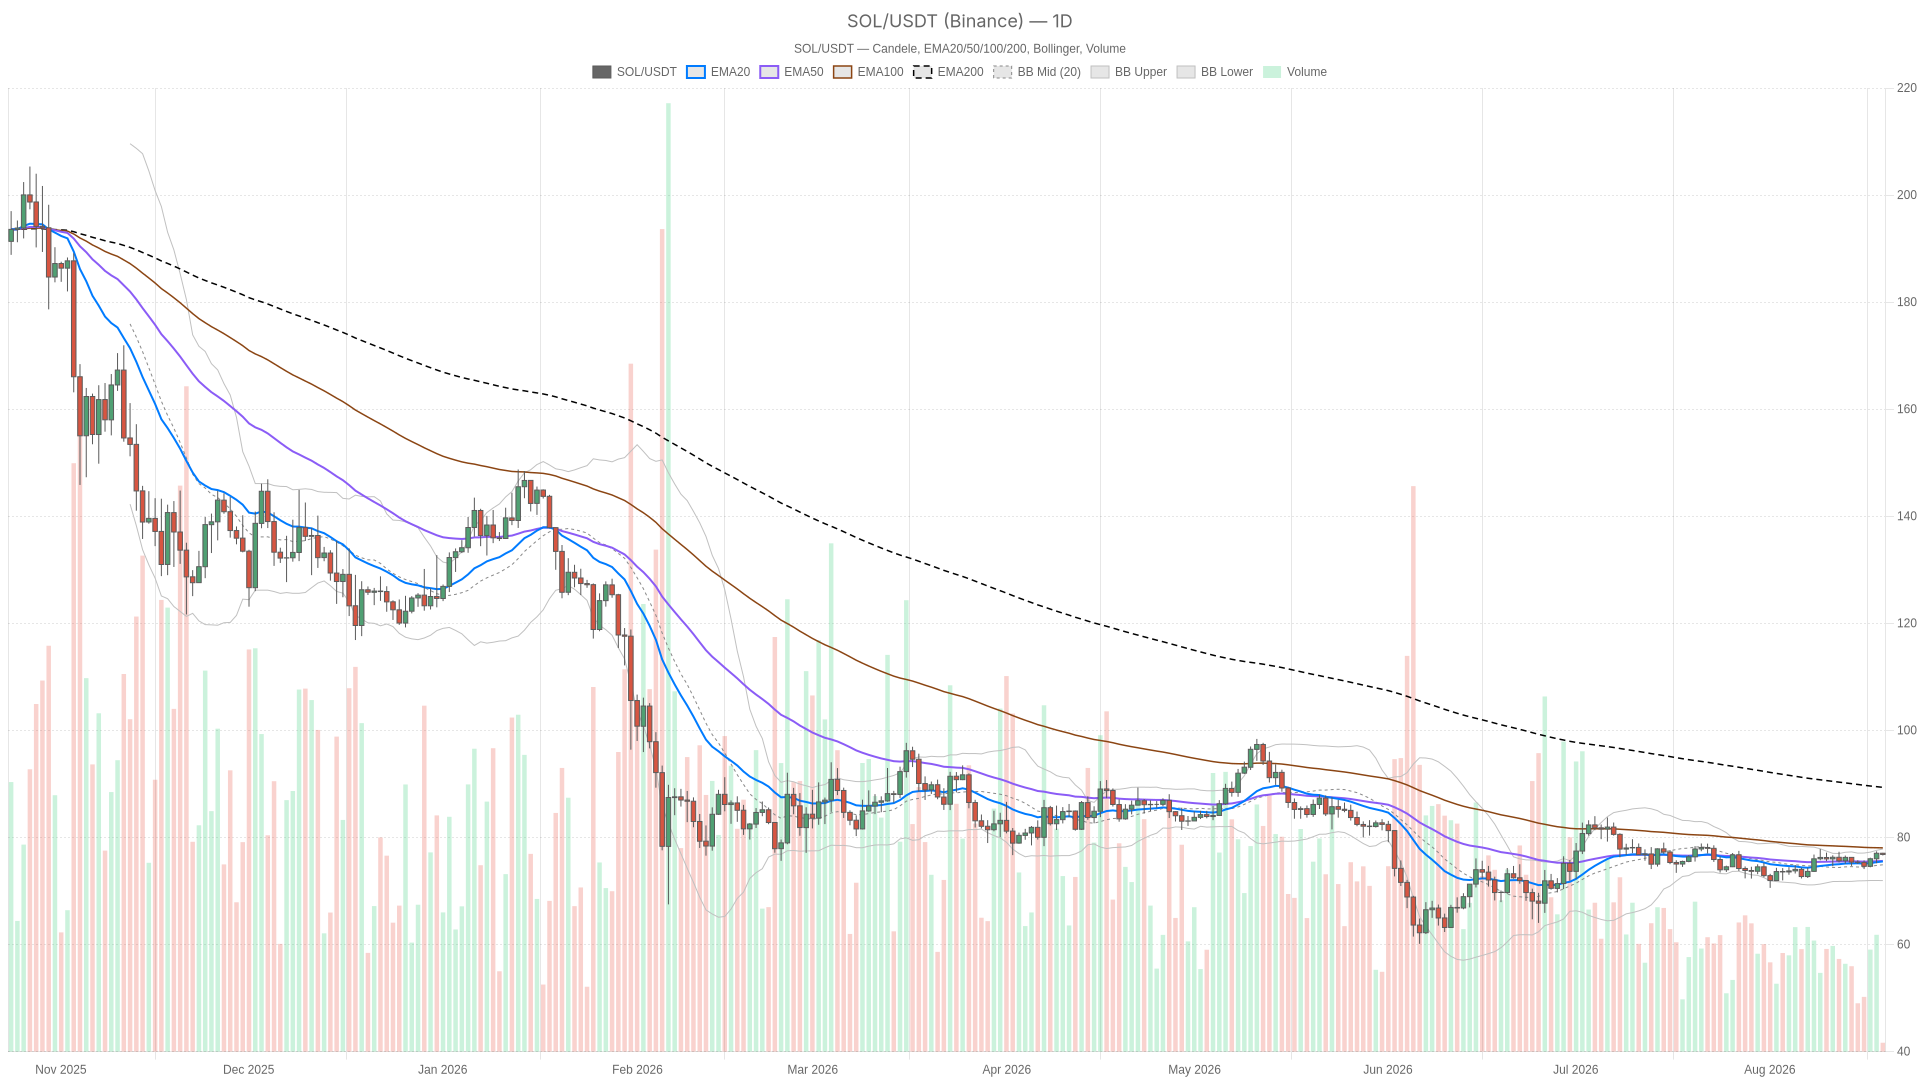
Al 19 de agosto de 2026, SOL cotiza a $76.83, situándose casi exactamente en su pivote diario de $76.86. La cripto Solana se encuentra en una encrucijada donde el impulso a corto plazo está construyendo un caso para la continuación, mientras que la tendencia diaria más amplia todavía lleva las cicatrices de una caída más profunda. Esa tensión define toda la configuración.
Análisis de cripto Solana: El pivote diario se mantiene ante un impulso mixto
El pivote de precio diario de Solana se mantiene, mientras que las señales de impulso siguen siendo mixtas. El análisis apunta a un mercado sin un consenso direccional claro a corto plazo.
The Cryptonomist
Publisher
Aug 19, 2026 at 2:19 AM UTC · 7 min de lectura
Key Signal
$76.83 SOL trading price
Entities
solana
Market Impact
SOL+0.66%$120.79
Last Updated
hace 2 meses
Puntos Clave
- Solana se mantiene alrededor de su nivel de pivote diario.
- Los indicadores de impulso se describen como mixtos en lugar de decisivamente alcistas o bajistas.
- La configuración sugiere que los traders esperan una confirmación más clara del próximo movimiento.
Conclusiones clave
- Solana cotiza a $76.83, precisamente en su pivote diario de $76.86, lo que señala indecisión del mercado en múltiples marcos temporales.
- La EMA200 diaria se sitúa en $89.36, más de $12 por encima del precio actual, lo que confirma que la estructura de la tendencia más amplia sigue siendo bajista.
- La actividad on-chain está aumentando: las comisiones de PumpSwap saltaron un 87.35% en un solo día y Raydium AMM registró un crecimiento de comisiones a 30 días del 82.79%.
- El Fear & Greed Index en 46 (Miedo) y la dominancia de Bitcoin en 56.55% sugieren un apetito de riesgo limitado para las rupturas de altcoins.
En esencia, la fuerza dominante en este momento no es una tendencia clara. Es un tira y afloja entre una estructura de corto plazo en recuperación y un gráfico diario que aún no ha reparado el daño de un retroceso mucho mayor. Entender qué lado gana esa lucha en las próximas sesiones es la clave de todo el juego.
Market Context
Article Intelligence
Key Entities
Raydiumsolana
Related Coverage
 CryptoChina's potential crypto reopening could spark a Bitcoin supercycle, says Solana CEO Joseph Chee.hace 2 horas · 1 min read
 DeFiSolana treasury DeFi Development authorizes CHAD preferred stock buyback programhace 3 horas · 1 min read
Sponsored
Ad
NewsLayerLearn more
NewsLayer Premium
Unlock deeper intelligence.
Ad-free reading, exclusive research, and real-time onchain insights.
Go Premium