


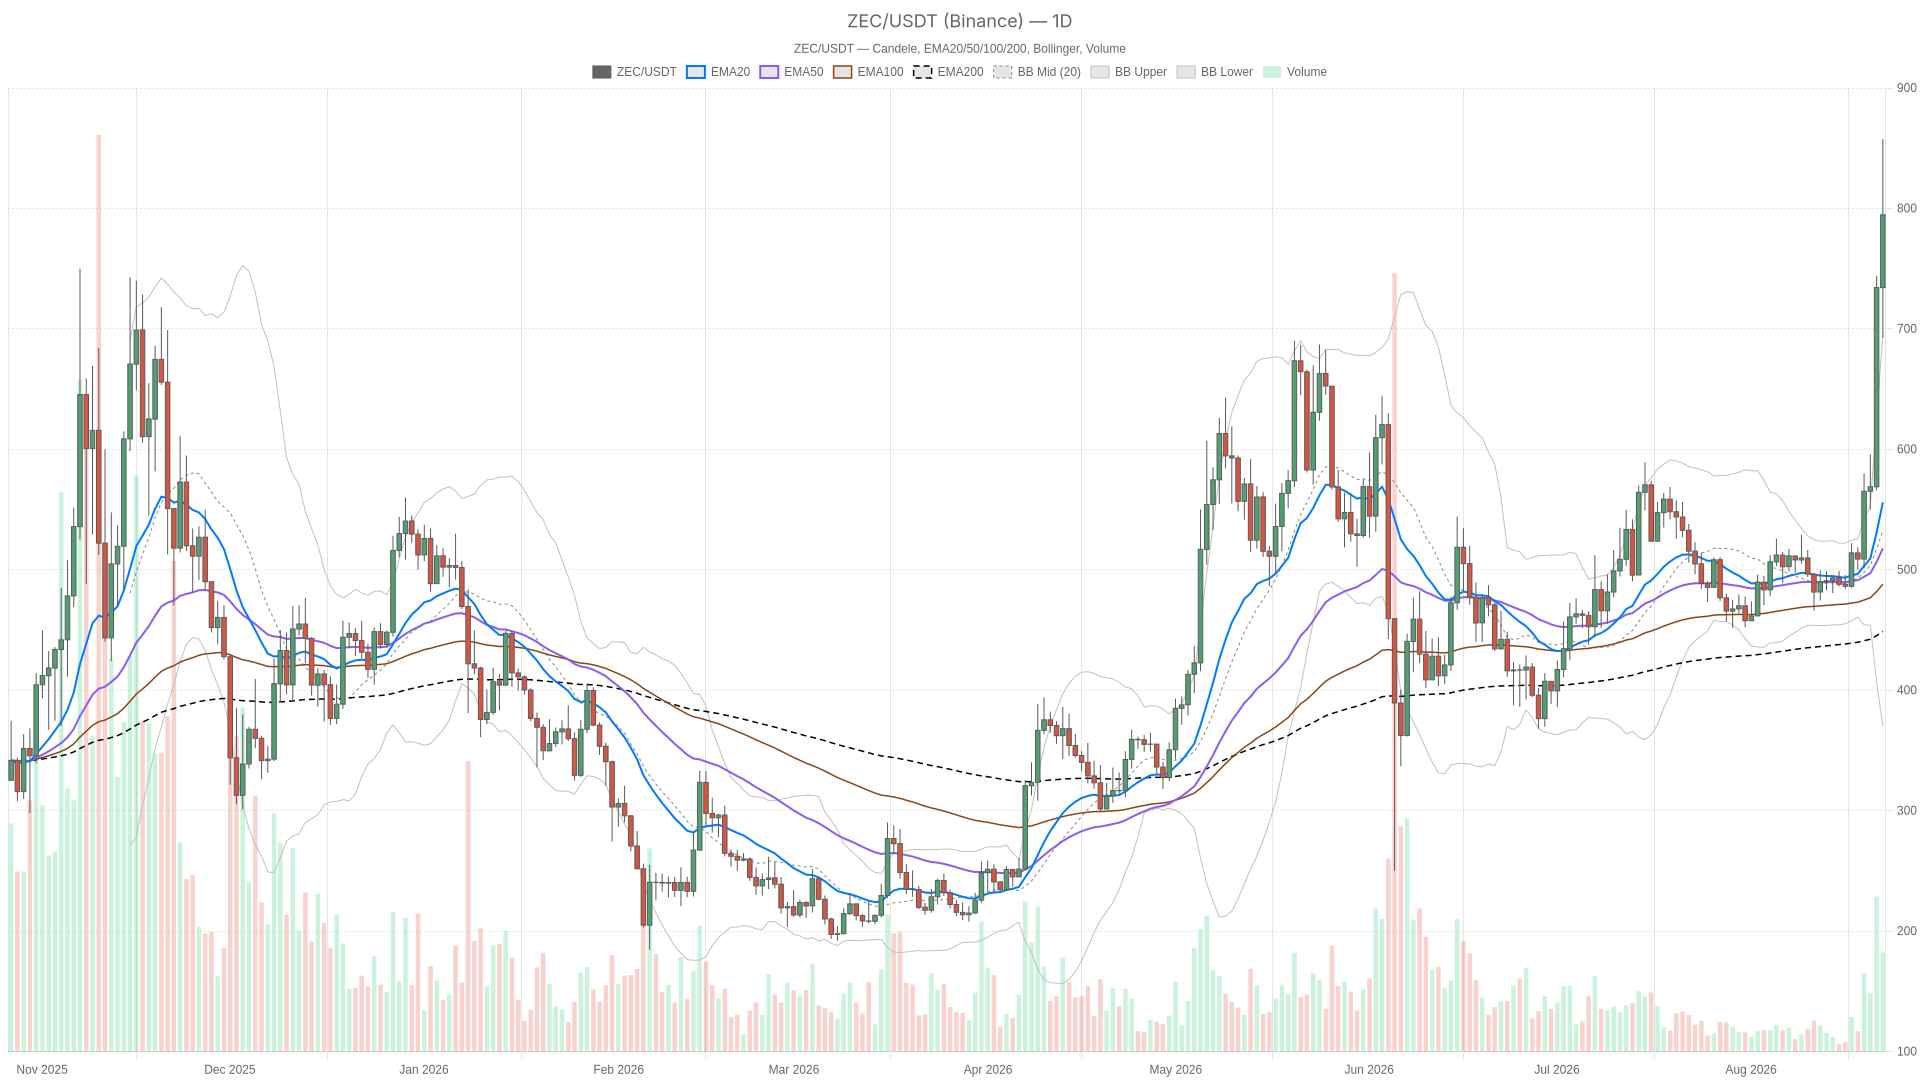
As of August 22, 2026, the Zcash crypto market presents one of the most stretched technical setups seen from this asset in a long time. $ZEC/$USDT trades at $794.69 on the daily chart, above the upper Bollinger Band, with an RSI reading of 86.27 — deep into unsustainable territory.
Zcash Crypto Surges to $794 as RSI Hits Extreme 86.27
As of August 22, 2026, the Zcash crypto market presents one of the most stretched technical setups seen from this asset in a long time. $ZEC/$USDT trades at $794.69 on the daily chart, above the upper Bollinger Band, with an RSI reading…
Cryptonews.net
Publisher
Aug 22, 2026 at 3:27 PM UTC · 5 min de lectura

Key Signal
$794.69 ZEC daily-chart price
Market Impact
BTC+2.00%$78,762
Last Updated
hace 2 días
Traduciendo…
Key takeaways
- $ZEC/$USDT trades at $794.69 with RSI at 86.27, deep in extreme overbought territory
- Price sits above the upper daily Bollinger Band at $694.68, a historically stretched position
- Bitcoin dominance holds at 58.73% while total crypto market cap slipped -0.67% in 24 hours
- Daily pivot at $781.67 and S1 at $705.70 define the near-term support zones to watch
- Hourly MACD histogram has flipped negative, suggesting momentum may be cooling
Daily Chart: Full Trend Mode, But Dangerously Extended
The daily structure leaves no ambiguity about direction. EMA20 (555.96), EMA50 (517.77) and EMA200 (448.75) are stacked in perfect bullish order, and price is trading nearly 43% above the EMA20 alone. That kind of separation only appears during genuine breakout phases, confirming the daily regime is unambiguously bullish. The MACD backs this up, with the line at 45.26 well above the signal at 15.98 and a rising histogram of 29.28.
Market Context
Bitcoin
BTC
$78,828
+2.09% (24H)
Market Cap
$1.58T
24H Volume
$30.3B
24H High
$78,828
Article Intelligence
Sponsored
Ad
NewsLayerLearn more
NewsLayer Premium
Unlock deeper intelligence.
Ad-free reading, exclusive research, and real-time onchain insights.
Go Premium