NewsLayer

Install NewsLayer

Get the app experience — one tap from your home screen, instant loads and breaking-news alerts.

Bitcoin, Gold Price Outlook: US CPI & Overbought Risks in Focus

Traduction…
Publié il y a 2 heures 5 min de lecture
Bitcoin, Gold Price Outlook: US CPI & Overbought Risks in Focus

Bitcoin, Gold Price Outlook: US CPI & Overbought Risks in Focus FOREX.com

Following a steep risk-on rally across US equity indices and precious metals, several major markets are approaching critical technical levels as momentum becomes increasingly stretched:

  • Dow Jones: Extended its rally toward the 54,700 record high and the upper boundary of its rising channel dating back to 2022, while monthly momentum is flashing overbought conditions last seen in 2018. Dow Analysis
  • Gold and silver: Broke above their year-long descending resistance structures and June-August consolidations, while daily momentum has entered overbought territory near critical resistance levels.
  • US Dollar Index (DXY): Dropped toward the rising support near 99.30 that has defined its bullish 2026 trend.
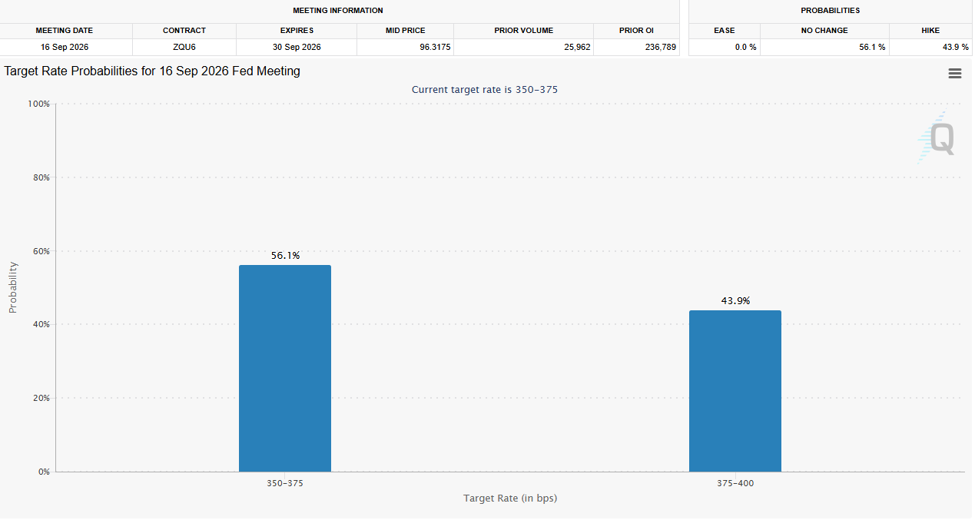
  • Fed expectations: September rate-hike expectations fell back below 50% following a weaker-than-expected Non-Farm Payrolls report. However, markets remain cautious ahead of Wednesday's US CPI report and amid ongoing tensions surrounding the Strait of Hormuz.
  • Bitcoin: Remains subdued despite broader market optimism, trading within its extended June-August 2026 consolidation and below the key $68,000 resistance level.

Whether Bitcoin is leading the next major risk-off move or simply lagging the broader market rally could become clearer as these key technical and macroeconomic catalysts unfold.

September Fed Rate-Hike Expectations Drop — For Now

Source: CME FedWatch Tool

Last week's weaker-than-expected US Non-Farm Payrolls report, at -23k, pushed expectations for a September Fed rate hike back below 50%, providing additional support for risk assets.

Attention now turns to Wednesday's CPI report. A stronger-than-expected inflation reading above 3.4% could revive rate-hike expectations and pressure stretched risk-on trends. Conversely, softer inflation could ease immediate tightening concerns, allowing any short-term correction to serve as a momentum reset rather than the beginning of a broader reversal.

Fear and Greed Index

Source: CNN

Despite slowing price momentum, overbought conditions on daily time frames, and persistent tensions surrounding the Strait of Hormuz, the Fear and Greed Index remains tilted toward risk appetite and continues to hold recent gains.

Key markets remain near elevated levels:

  • Dow Jones: Near 54,000
  • Gold: Near 4,370
  • S&P 500: Near 7,770

Despite these strong rallies, several intermarket signals suggest investors continue to price in geopolitical uncertainty:

  • The US Dollar Index (DXY) remains above its 2026 uptrend support near 99.30.
  • WTI crude oil remains above $72 per barrel. Crude oil analysis
  • Bitcoin continues to trade below $68,000 and within its June-August consolidation rather than confirming the broader risk-on move.

Together, these signals suggest caution remains warranted unless the dollar and crude oil continue to weaken while Bitcoin begins to confirm improving risk appetite.

Bitcoin Price Outlook: 3-Day Time Frame — Log Scale


Source: TradingView

Bitcoin continues to trace a technical structure similar to those previously seen across precious metals, particularly gold and silver, forming a contracting consolidation near its 2026 lows between June and August.

A breakout above the upper boundary of this consolidation and the $68,000 resistance level would confirm strengthening momentum and expose the first upside objective near $74,000-$77,000, followed by $84,000-$88,000.

The latter represents a major long-term resistance zone, aligning with the 27.2% Fibonacci retracement of the 2025-2026 decline and serving as an important dividing line between the longer-term bullish and bearish outlooks.

Conversely, failure to break above $68,000 would leave Bitcoin vulnerable to another decline. A confirmed break below the $60,000-$58,000 support zone would expose the $49,000-$50,000 region, near the August 2025 lows, where another longer-term accumulation opportunity could emerge.

For now, Bitcoin's consolidation appears to represent a lagging accumulation phase awaiting broader confirmation that the recent improvement in global risk sentiment is becoming more sustainable.

Gold Price Outlook: Daily Time Frame — Log Scale


Source: TradingView

From a daily time frame perspective, gold is confirming a bullish breakout above its June-August contracting consolidation, previously ranging between 3,930 and 4,200, as well as above the descending resistance that had guided price action since March 2026.

Key support: 4,050-3,960-3,930

Gold Bullish Scenario

A sustained recovery above 4,370 and 4,470 would shift both the short- and longer-term outlooks further in favor of buyers. Such a move would strengthen the broader recovery case across precious metals and increase confidence that gold's longer-term uptrend has resumed.

However, the daily RSI continues to push deeper into overbought territory, reaching levels last seen in January 2026 when gold tested its 5,600 record high. This raises the risk of a short-term pullback or consolidation before another potential upside extension.

Gold Bearish Scenario

On the downside, a break below 4,300 and 4,200 would expose the 4,140-4,160 region as another potential dip-buying zone.

Should this area fail to hold, gold could retest the broader 4,050-3,960-3,930 support zone. A sustained break below this region would reactivate the broader bearish scenario.

The next downside objectives would be:

  • 3,880-3,840: Corresponding to the October 2025 lows.
  • 3,700
  • 3,500-3,460: A well-respected five-month resistance zone throughout 2025 and the 38.2% Fibonacci retracement of the 1920-2026 advance.

These longer-term support zones could provide significant reversal opportunities should a deeper correction develop.

As long as the US Dollar Index and crude oil remain firm, downside and volatility risks across currencies and precious metals are likely to remain elevated.

Gold Price Outlook: 6-Month Time Frame — Log Scale


Source: TradingView

From a six-month perspective, gold is rebounding from one of its most significant long-term technical confluence zones in decades.

The area combines:

  • The 27.2% Fibonacci retracement of the secular advance from 1920 to 2026.
  • The long-term trendline connecting major highs between 2016 and 2025. What previously acted as resistance has now become one of gold's most important long-term support areas in 2026.
  • The completion of a six-month shooting-star reversal pattern.

Given the significance of this support zone and the fragile US-Iran geopolitical backdrop, the longer-term structure remains particularly sensitive to a break below 3,930.

A sustained move below this technical confluence would expose the 38.2% Fibonacci retracement around 3,500-3,460, an area that acted as major resistance throughout much of 2025.

With gold, Bitcoin, the US Dollar Index, and major equity indices simultaneously approaching critical technical levels, Wednesday's US CPI report could provide an important catalyst for determining whether stretched risk-on trends extend or enter a broader corrective phase.

Written by Razan Hilal, CMT
Follow on X: @Rh_waves

Attribution

Originally reported by FOREX.com

Get stories like this, daily.

Daily crypto + regulation intelligence, straight to your inbox. Free.

Articles Liés

ALERTE : Le Bitcoin rebondit sur la moyenne mobile à 200 semaines, ce qui a historiquement été une excellente opportunité d'achat 👀 Bullish ! 🚀REBOND HAUSSIER

ALERTE : Le Bitcoin rebondit sur la moyenne mobile à 200 semaines, ce qui a historiquement été une excellente opportunité d'achat 👀 Bullish ! 🚀

Le Bitcoin testerait sa moyenne mobile à 200 semaines, un indicateur technique à long terme surveillé par les acteurs du marché. La publication qualifie ce niveau de zone d'achat historiquement favorable, bien qu'elle ne fournisse pas de données de prix à l'appui ni de garantie sur les performances futures.

il y a 11 minutes

1 min de lecture