
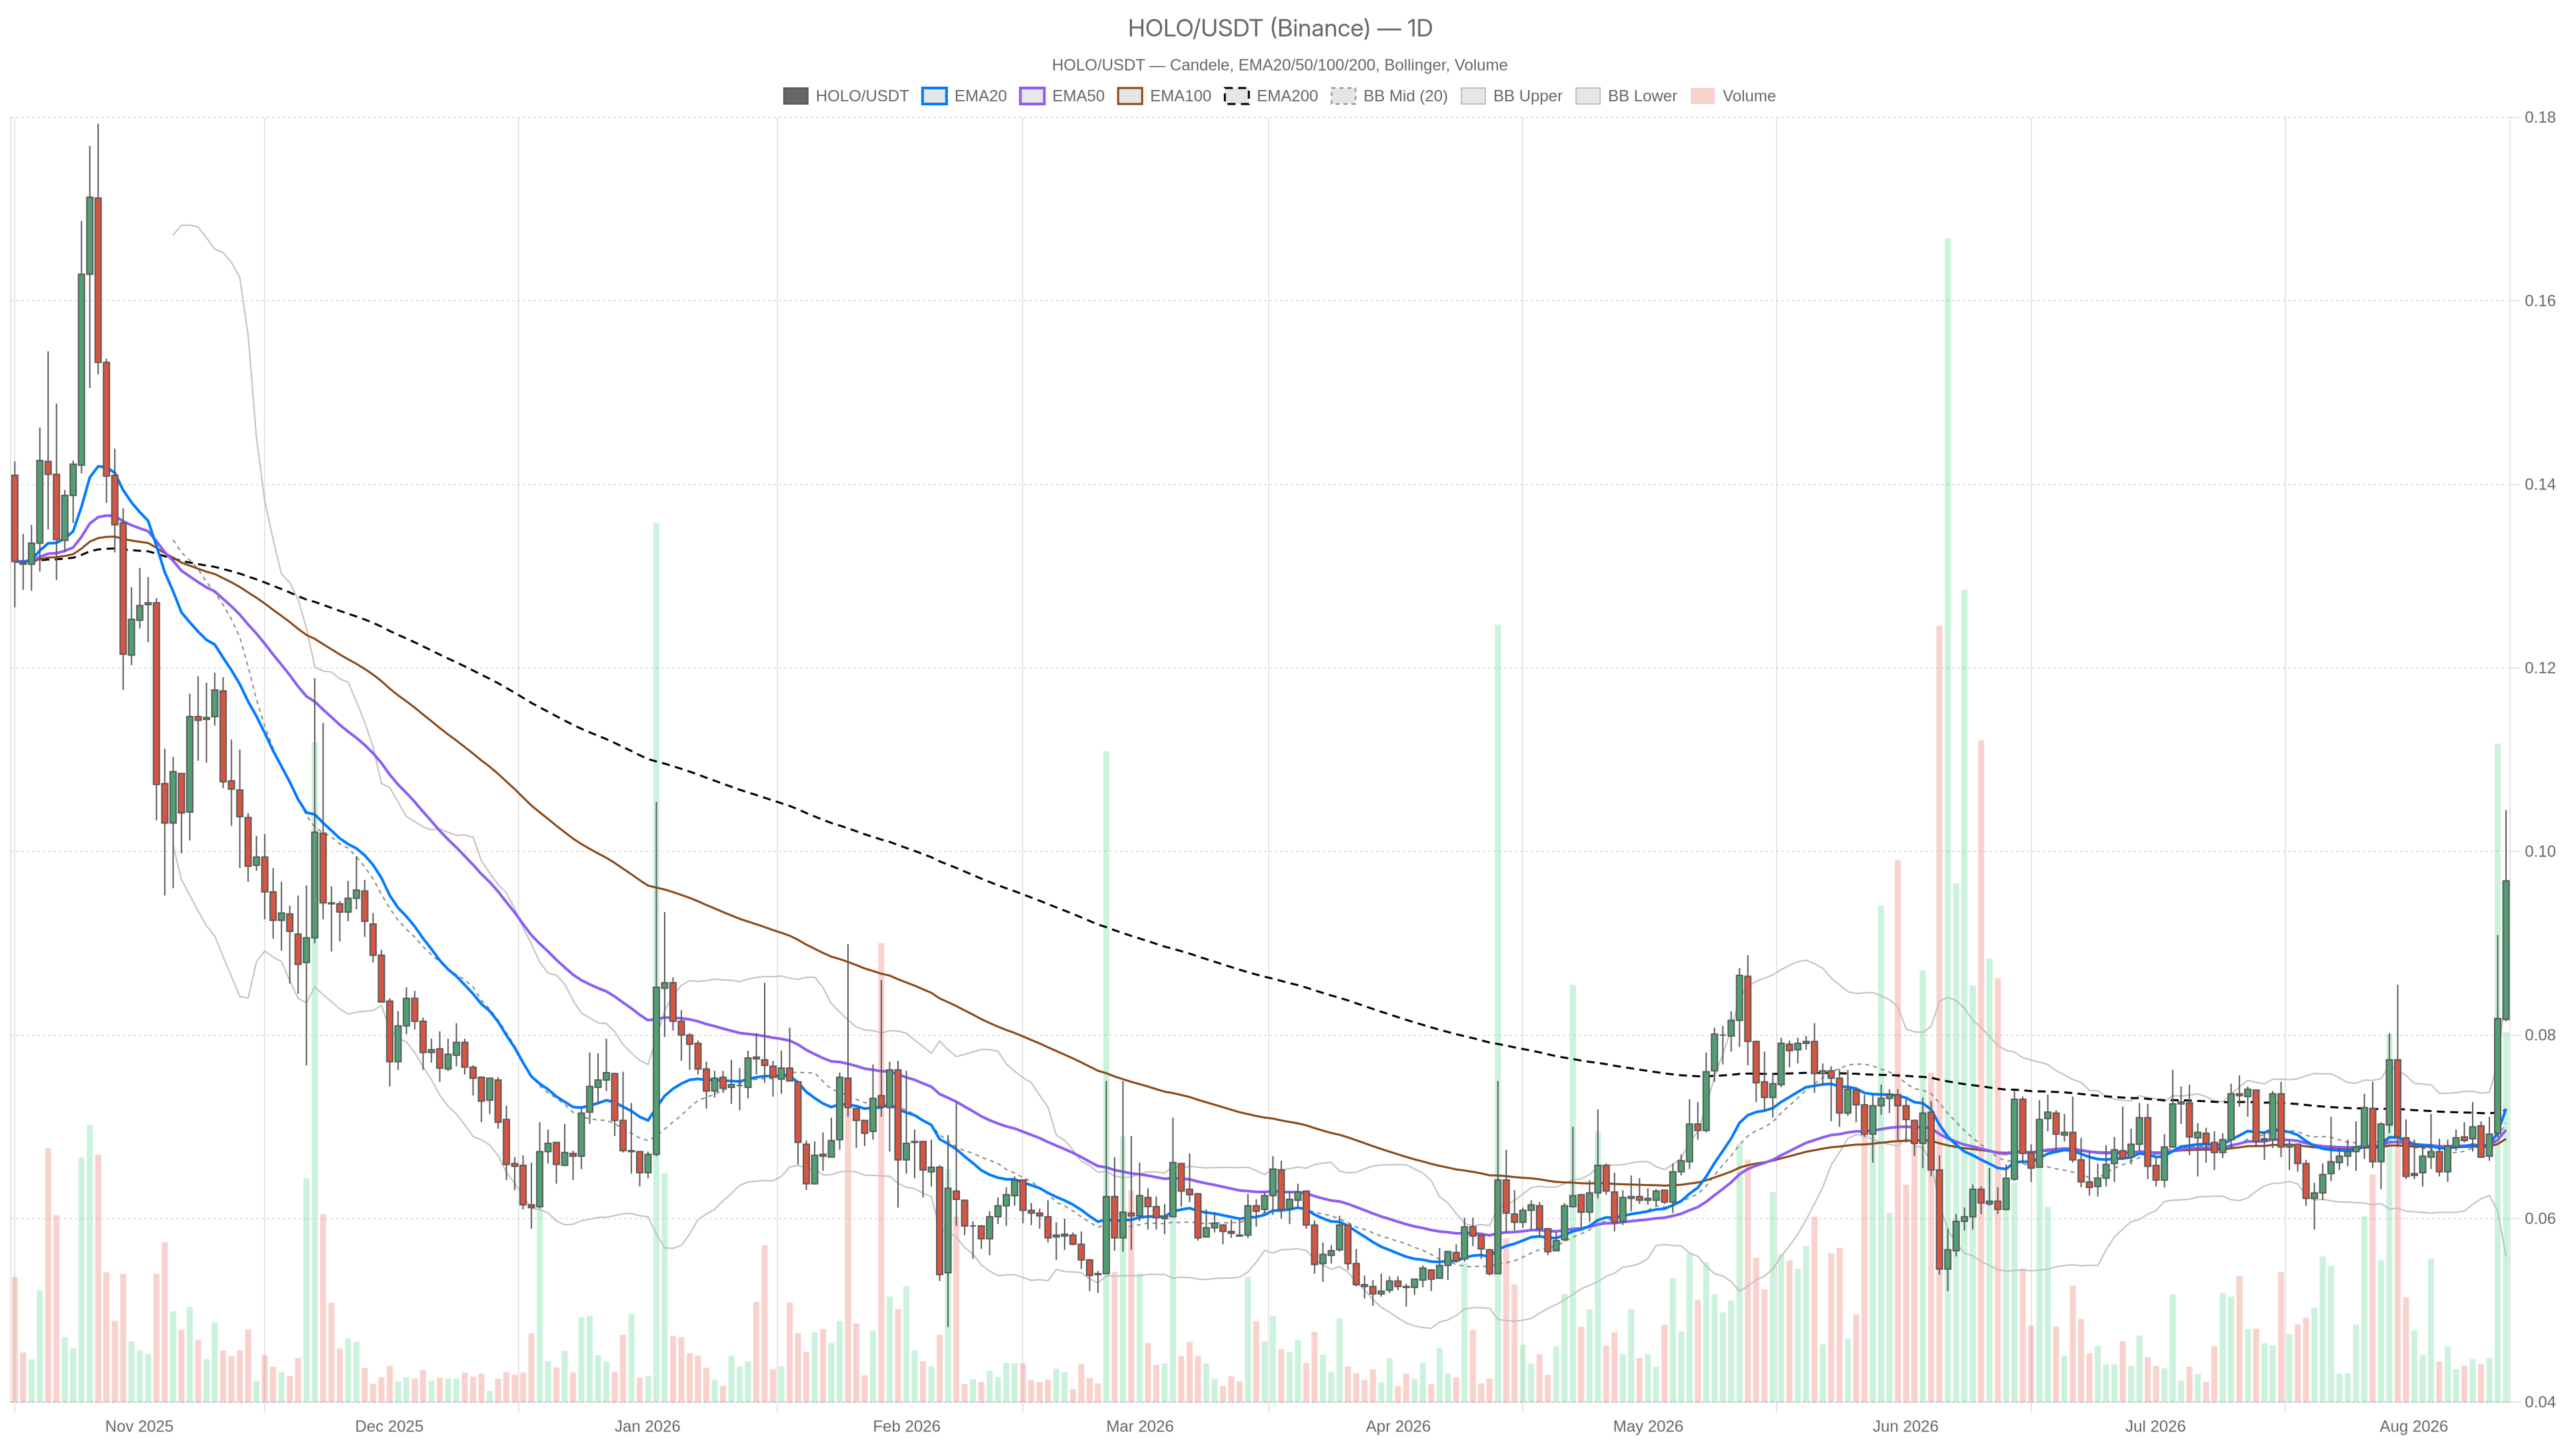
As of August 12, 2026, while the broader crypto market trades flat and sentiment registers outright fear, Holoworld crypto is doing something markedly different. HOLOUSDT sits at 0.10 against a daily EMA cluster at 0.07, a separation that signals aggressive repricing rather than slow accumulation.
Key takeaways
- HOLOUSDT trades at 0.10, roughly 30% above its daily EMA cluster at 0.07
- Daily RSI at 74.52 signals strong momentum but also warns of stretched conditions
- Price sits above the daily upper Bollinger band, creating a volatility breakout scenario
- The Fear & Greed Index at 27 and BTC dominance at 56.31% create a defensive macro backdrop
- The 0.09 level serves as the critical intraday floor for the bullish thesis
What the daily chart reveals about the breakout
The daily chart shows HOLOUSDT in an extended trend that has moved too fast for its averages to catch up. Price at 0.10 sits well above a triple-EMA cluster at 0.07, and the regime tag reads neutral — yet the levels tell a different story. One impulsive leg does not rewrite a base that spent months flat and compressed. The macro bias is constructively bullish in direction but structurally immature; no trailing support exists near current price. The nearest genuine reference is 0.07, roughly 30% lower.
RSI and MACD: hot momentum, silent confirmation
Daily RSI at 74.52 is the cleanest evidence of the impulse. In a young trend, that reading usually fuels continuation. However, given how far price has detached from its averages, it also warns that the marginal buyer is already in. The next resolution is likely to be violent in either direction, not as a short signal but as a reason for caution.
The daily MACD, by contrast, prints line, signal and histogram effectively flat at zero. At this price scale, the indicator lacks the resolution to say anything useful. Momentum confirmation on the daily is absent — the bullish case rests on price displacement and RSI, not on a fresh crossover. The 1H MACD does show the line at 0.01 above a flat signal, which is the only trend-following confirmation in the set.
Bollinger Bands and ATR: price outside the envelope
The daily Bollinger structure places the midline at 0.07, the upper band at 0.08 and the lower band at 0.06. Meanwhile, price at 0.10 is trading clean above the upper band. Statistically, this is a volatility breakout, not a normal trend continuation. It resolves one of two ways: either the bands expand upward to accommodate the new range, or price reverts violently toward the 0.08 band and then the 0.07 midline. There is no comfortable third option.
Daily ATR of 0.01 puts that in perspective: one average daily range equals roughly 10% of current price. On the 15-minute chart, ATR has compressed to near zero, which usually signals digestion rather than distribution. Compression after expansion is a setup, not a direction.
Multi-timeframe analysis: 1H confirms, 15m executes
The 1H timeframe is the one that actually supports the bullish case. The regime is bullish, with EMA20 and EMA50 lifted to 0.08 and EMA200 at 0.07 — properly stacked under price. RSI at 73.67 mirrors the daily heat. Moreover, price at 0.10 sits exactly on the 1H upper Bollinger band, with the midline at 0.08. Riding the upper band on an hourly chart is classic trend behaviour, but it also means every push higher happens at the statistical edge of the range.
The 15-minute chart is calmer and healthier: RSI has cooled to 61.44, while EMA20 and EMA50 sit at 0.09 with EMA200 at 0.08. That cooldown without a price breakdown is the constructive detail in this whole picture — momentum bled off while price held. For execution, the 0.09 shelf on the 15m is the line separating orderly consolidation from an unwind.