
Solana Price: What the Charts aren’t Telling You
Solana price has become an unusual story this quarter. Network usage is accelerating while SOL remains below its recent highs.
CryptoRank
Publisher
Oct 4, 2026 at 12:52 PM UTC · Updated il y a 14 heures · 3 min de lecture

Entities
solana
Market Impact
SOL-0.30%$120.25
Last Updated
il y a 14 heures
Traduction…
- Solana’s price remains below recent highs as the network processed 14.2 billion transactions in Q3.
- Solana network activity jumped 45% from Q2, marking a quarterly record.
- ETF inflows and rising usage add support to the SOL crypto price narrative.
Solana price has become an unusual story this quarter. Network usage is accelerating while SOL remains below its recent highs.
Solana processed a record 14.2 billion non-vote transactions in Q3, up 45% from Q2, according to Blockworks data cited by Solana on Oct. 3. Non-vote transactions exclude validator voting and focus more closely on activity involving users and applications.
The gap between that network record and the token chart is where the story gets interesting. SOL entered October near $119, according to CoinGecko historical data. It closed Oct. 1 at $118.38, after reaching a late-September high above $124.
Solana Price and the Network’s Busiest Quarter
The Solana network recorded its highest quarterly total for non-vote activity, according to Blockworks figures. That number includes user-driven actions such as transfers, swaps, and decentralized application activity.
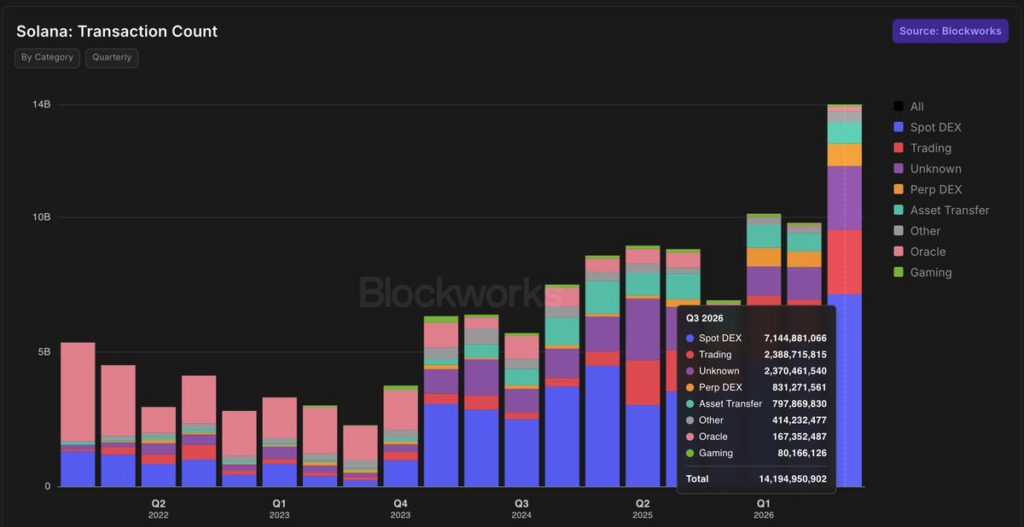
It excludes validator vote traffic, which can make raw blockchain transaction figures harder to compare.
Market Context
Solana
SOL
$120.18
-0.36% (24H)
Market Cap
$70.9B
Circulating Supply
588.3M SOL
24H Volume
$2.2B
24H High
$122.25
Article Intelligence
Key Entities
Sponsored
Ad
NewsLayerLearn more
NewsLayer Premium
Unlock deeper intelligence.
Ad-free reading, exclusive research, and real-time onchain insights.
Go Premium