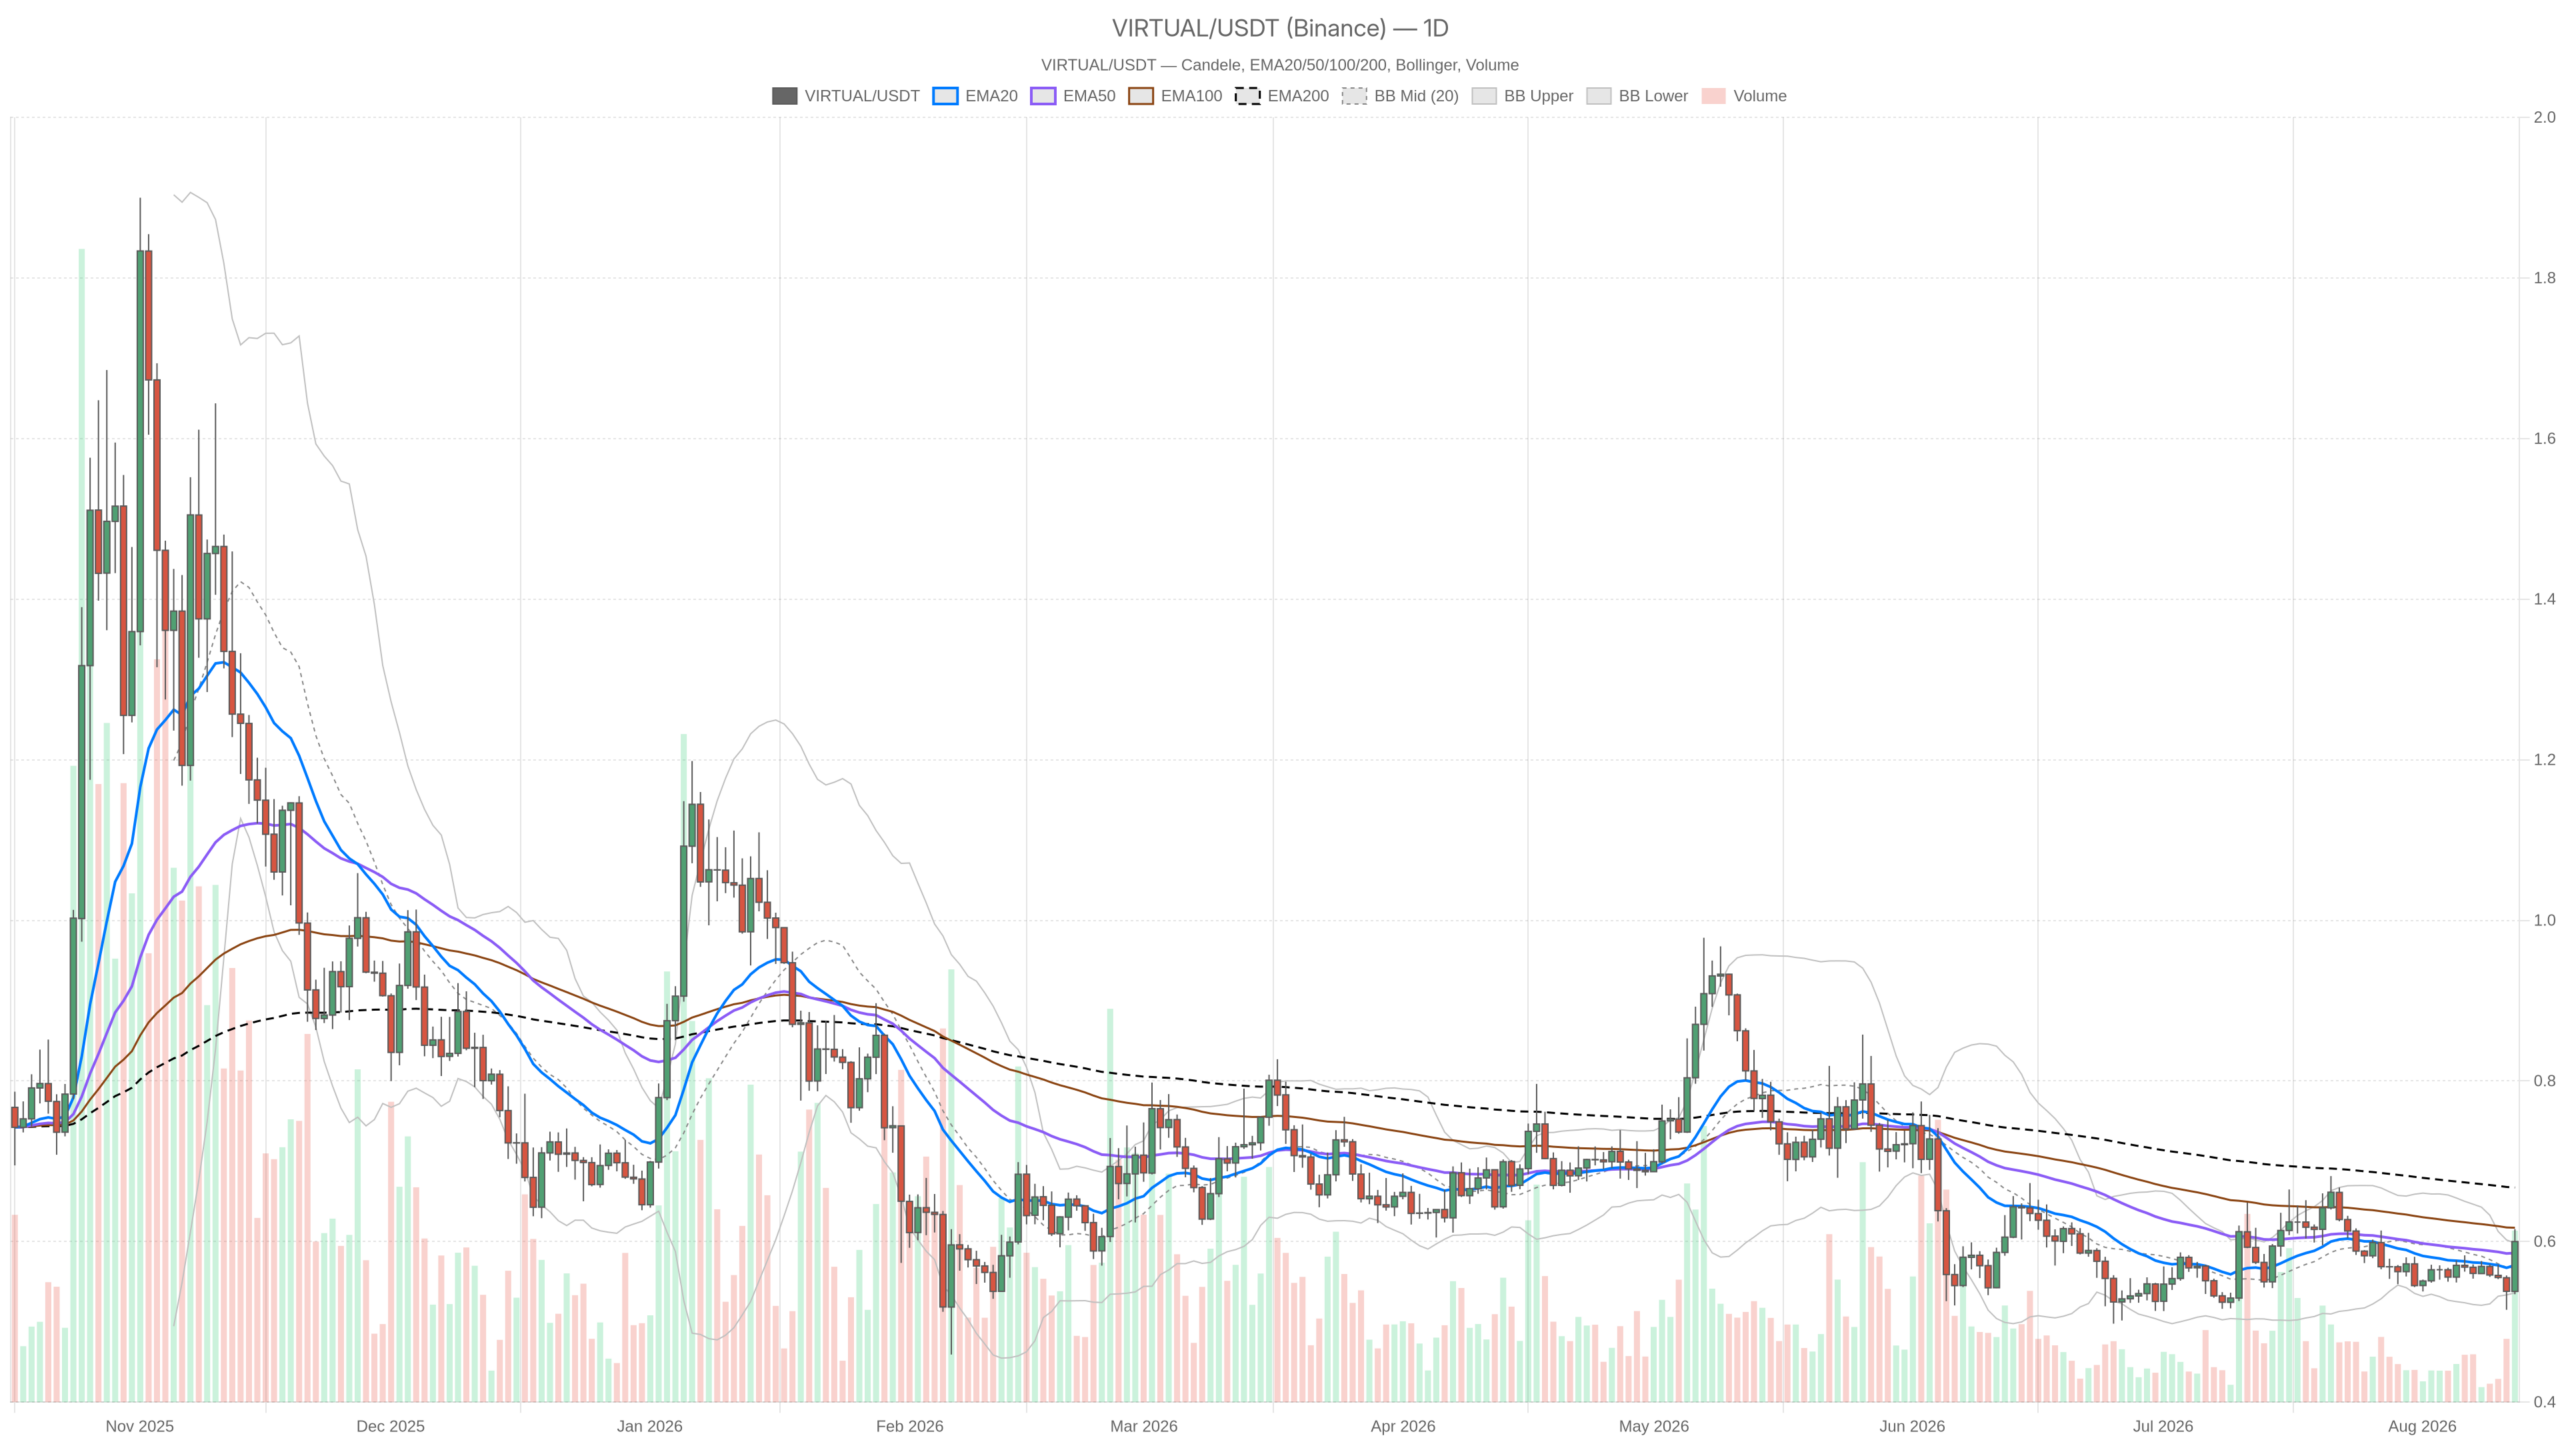
Markets often reveal their hand at inflection points, and on August 12, 2026, Virtuals Protocol crypto sits at precisely such a juncture. Price has climbed to 0.60 against $USDT, pressing into the upper daily Bollinger Band while the broader chart still carries the scars of a longer corrective phase.
Key takeaways
- $VIRTUAL trades at $0.60, pressing the upper daily Bollinger Band while remaining about 10% below its 200-period EMA at $0.67.
- The 1H chart shows an overbought RSI of 70.39, suggesting the intraday rally may be stretched.
- Broader sentiment remains cautious with the Fear & Greed Index at 27 and Bitcoin dominance at 56.19%.
- Daily R1 resistance at $0.63 is the critical level bulls need to reclaim for a confirmed breakout.
- Daily MACD sits flat with a zero histogram, indicating a market that is stabilizing rather than trending.
What the Daily Chart Reveals
The daily chart reveals a market stabilizing under resistance, with price above short-term moving averages but still well below the long-term trend indicator. On the daily timeframe, $VIRTUAL closed at $0.60, above its EMA20 at $0.57 and EMA50 at $0.59. However, it remains well under the EMA200 at $0.67. This is the key structural fact: short-term moving averages have flipped supportive, but the long-term trend average stays overhead. That keeps the macro bias defined as corrective-to-neutral rather than outright bullish.
RSI14 on the daily sits at 56.38. Moreover, it is the kind of reading that says buyers have the edge but have not forced anything decisive yet. The daily MACD is essentially flat, with the line and signal both at -0.01 and a histogram of zero. Momentum on the higher timeframe sits right at the pivot between negative and positive. It has not confirmed a bullish cross, but it is no longer accelerating lower either.
Bollinger Bands on the daily chart show the mid-band at $0.57, the upper band at $0.60, and the lower band at $0.54. That said, price sitting right at the upper band is typically a short-term overextension signal. It is not a reason to panic, but a reason to expect either a breakout attempt or a pullback toward the mid-band. Daily ATR14 at $0.03 tells you volatility is moderate relative to price, so moves in either direction should not be violent, just directional.
The daily pivot structure reinforces the decision-point narrative. The pivot sits at $0.58, resistance R1 at $0.63, and support S1 at $0.55. Price trading above the pivot is a mildly bullish signal. However, R1 at $0.63 is the level that would actually confirm strength. Until then, the daily chart describes a market that is cautiously testing rather than breaking out.
Intraday Momentum Outpacing the Daily Trend
The 1H and 15-minute charts reveal an aggressive bullish push that has already reached overbought levels, suggesting the rally may be running ahead of the broader market structure. Zooming into the 1H chart, the picture gets noticeably more aggressive. Price at $0.60 trades above all three EMAs. The 20 sits at $0.57, the 50 at $0.56, and the 200 at $0.56. That is a textbook bullish stack for the intraday timeframe. RSI14 on the 1H sits at 70.39, firmly in overbought territory.
This does not automatically signal a reversal, but it does mean the current push has already covered significant ground. Chasing at this level carries more risk than it did a few hours ago. MACD on the 1H is positive and rising, with the line at 0.02, signal at 0.01, and histogram at 0.01. This confirms the intraday bullish momentum is real, not just noise. The 1H Bollinger Bands show the mid-band at $0.56 and the upper band at $0.61, with price once again pressing close to the upper boundary, echoing the daily setup.
Moreover, the 1H pivot levels tell an interesting story. Pivot, R1, and S1 are all clustered at $0.60, meaning price sits almost exactly on top of its own equilibrium. There is very little room before the next decision. That kind of compression often precedes a short, sharp move rather than a slow grind. On the 15-minute chart, the regime is explicitly tagged bullish, with all EMAs stacked correctly beneath price.
However, a subtle but important detail emerges on the fastest timeframe. RSI14 at 63.99 is warm but not extreme, and MACD is only marginally positive at 0.01/0.01 with a flat histogram at zero. Momentum here is decelerating even as the trend label remains bullish. The 15-minute chart is already showing signs of losing steam while technically still in an uptrend, a divergence worth noting.
Reading the Broader Market Backdrop
The broader market backdrop shows cautious sentiment, with the Fear & Greed Index in Fear territory and Bitcoin dominance elevated, creating headwinds for altcoin breakouts. Context matters here. The Fear & Greed Index sits at 27, classified as Fear, even though total crypto market cap is up a modest 0.34% over 24 hours, based on CoinGecko figures. Bitcoin dominance at 56.19% suggests capital remains concentrated in BTC rather than rotating aggressively into altcoins. That is generally a headwind for a name like Virtuals Protocol crypto trying to sustain a breakout.
On-chain activity sends mixed signals too. DEX fee data shows Uniswap V3 up 13.51% over 7 days and 49.81% over 30 days, while Fluid DEX surged 96.17% over the past week, according to DefiLlama-style fee tracking. These are signs of real trading activity picking up in parts of DeFi. Yet Curve DEX fees dropped 62.63% over 7 days and Ekubo fell 51.69% over the same period.
The risk appetite showing up on-chain is uneven, not broad-based. That inconsistency lines up with what the charts are showing: pockets of strength, not a uniform risk-on wave. There is also a regulatory undercurrent worth noting. Nigeria has moved to tighten rules on virtual assets specifically to boost tax revenue, per Bloomberg reporting from early August. Separately, Bloomberg covered renewed concern around offline Bitcoin holdings being drained by hackers.
Neither story is about $VIRTUAL directly, but both feed into the same cautious sentiment backdrop reflected in that Fear & Greed reading. Regulatory friction and security headlines do not help speculative altcoin flows. When the macro mood is fearful and on-chain activity is inconsistent, breakouts tend to face more scrutiny and require stronger confirmation than they would in a risk-on environment.