
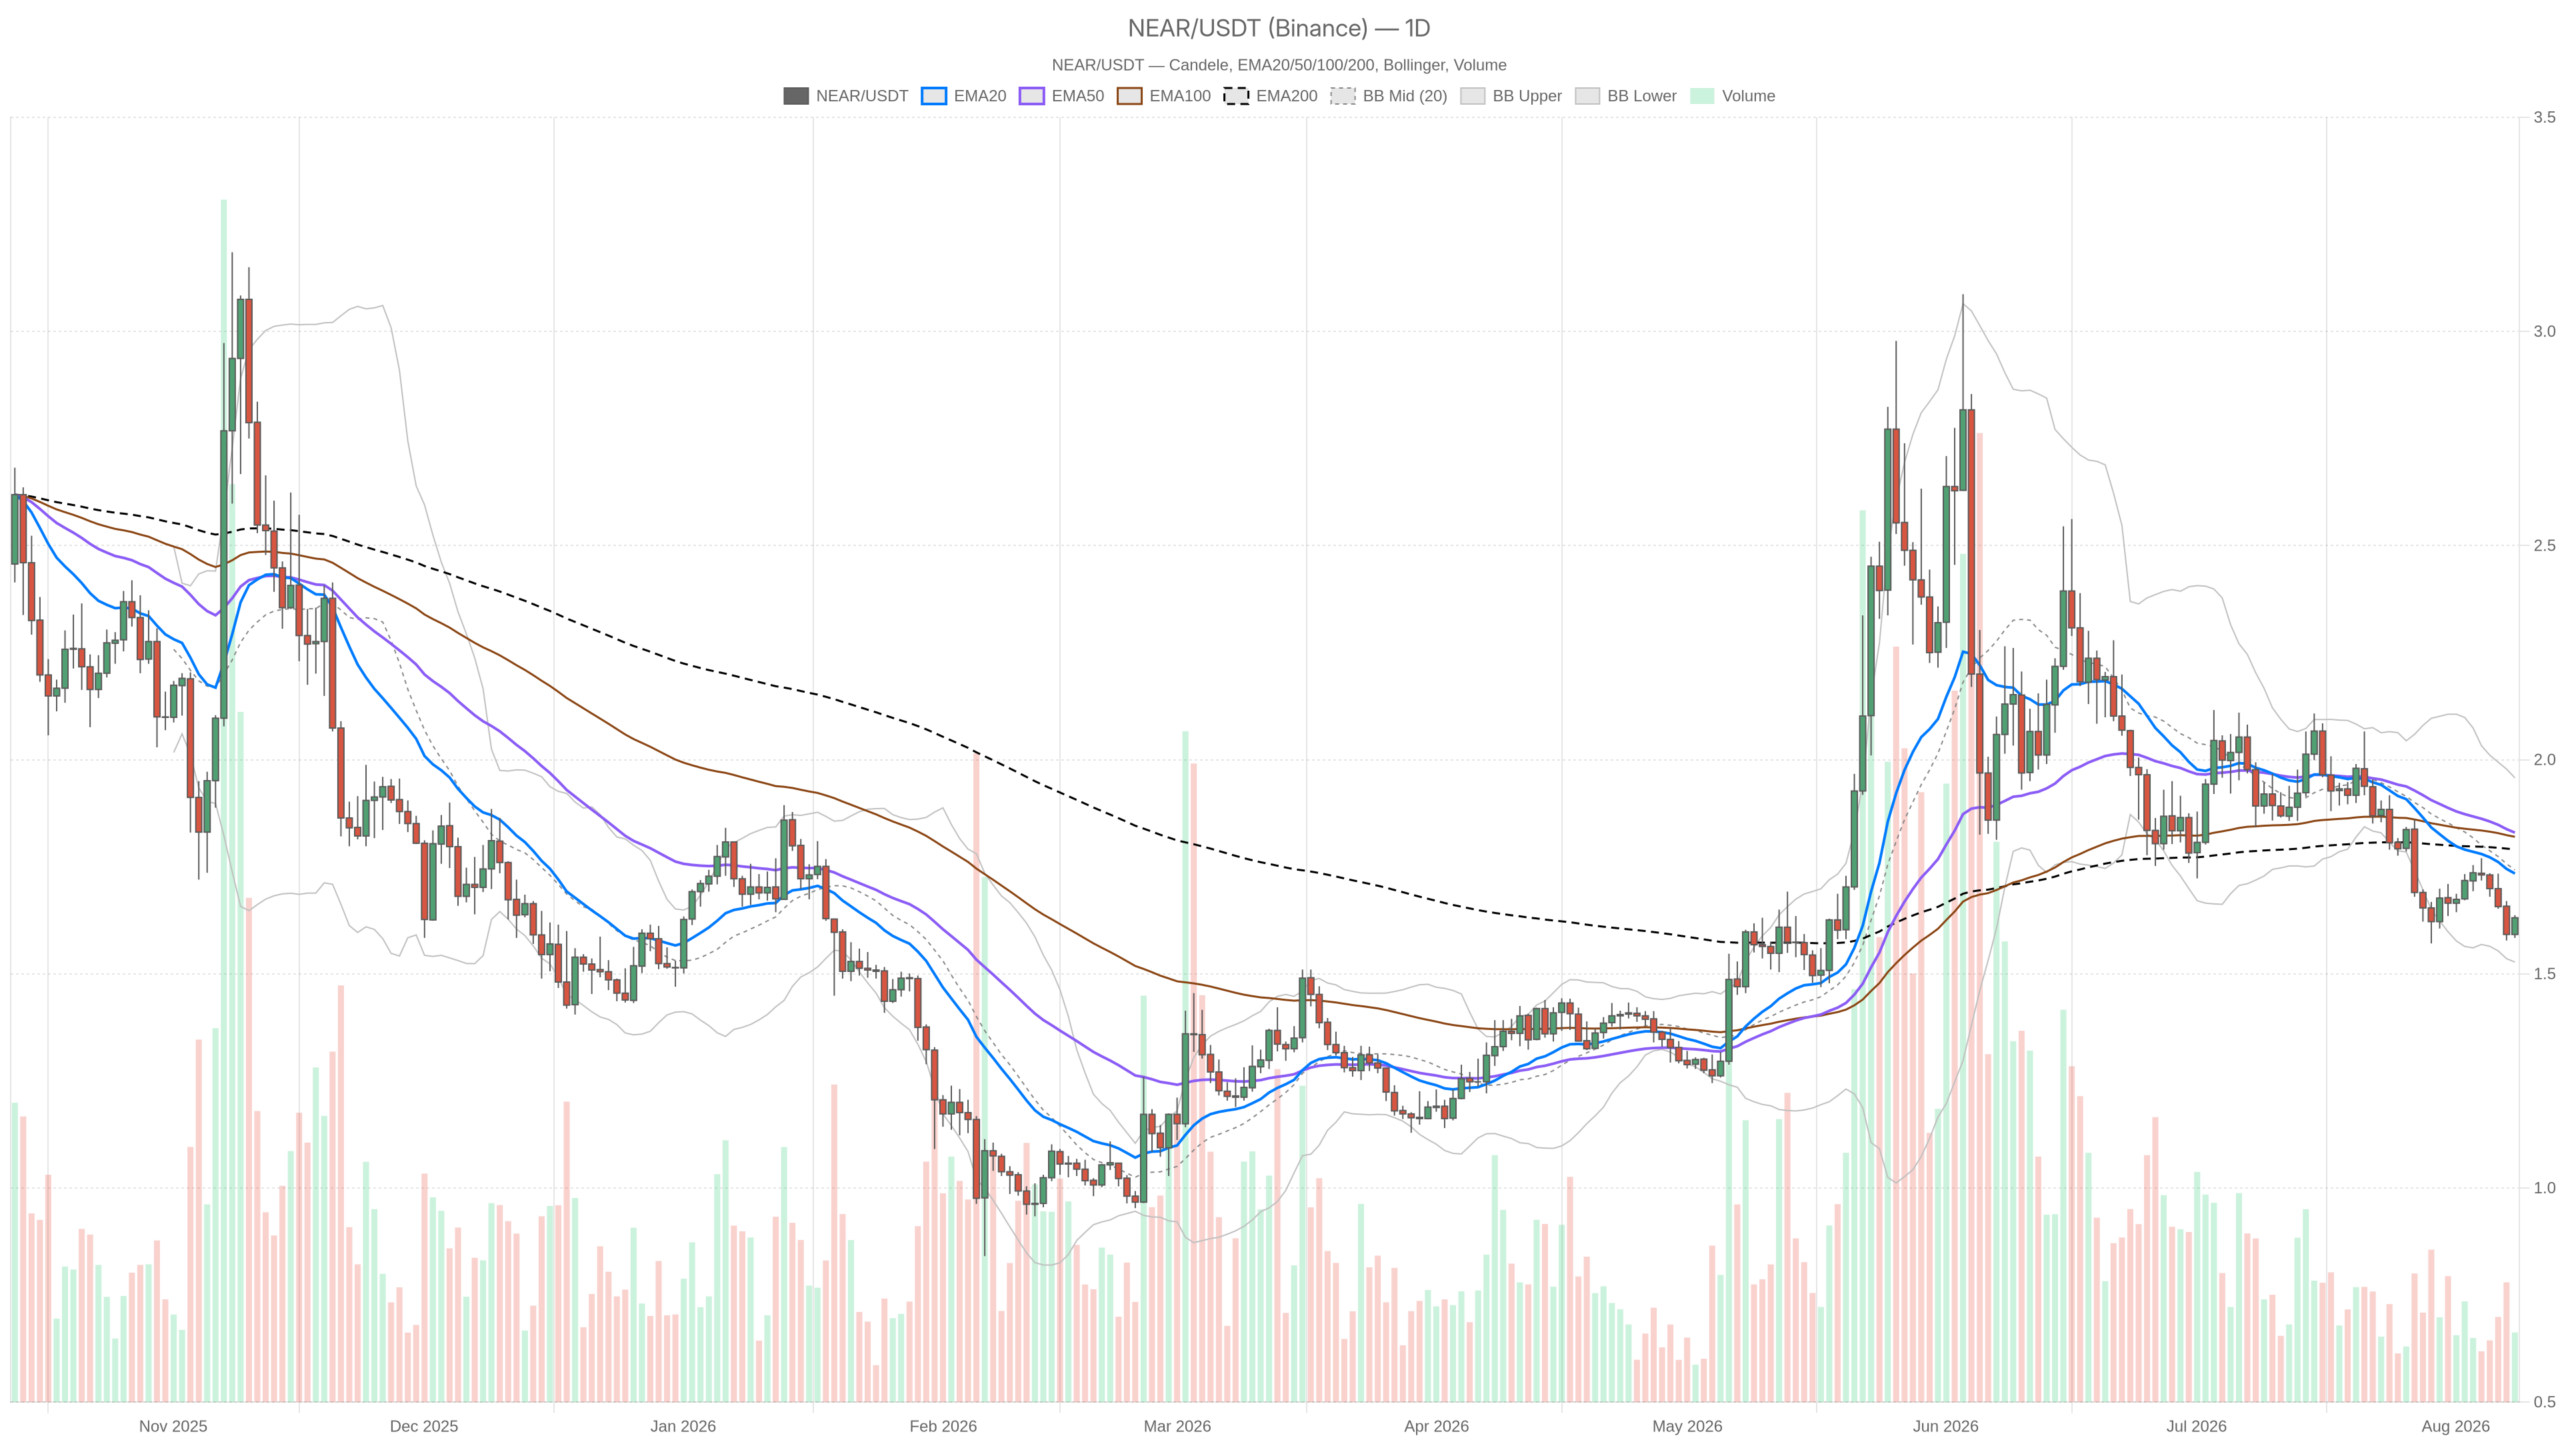
As of August 8, 2026, the chart for $NEAR Protocol crypto tells two stories at once, and the gap between them is where the trade lives. On the daily timeframe, price sits at $1.63 — below all three major EMAs — a textbook damaged structure where every bounce gets sold.
Key takeaways
- $NEAR trades at $1.63, pinned below the 20-EMA ($1.73), 50-EMA ($1.83), and 200-EMA ($1.79) on the daily chart.
- Daily RSI reads 38.02, confirming persistent weakness without an oversold capitulation signal.
- Intraday ATR has collapsed to $0.01, while daily ATR sits at $0.08 — a compression pattern that precedes sharp directional moves.
- Total crypto market volume is down 37.19%, and the Fear & Greed Index stands at 30 (Fear), signaling a low-conviction environment.
- On-chain activity across $NEAR Intents and major dApps is contracting, with daily fees dropping 13.36%.
The Daily Chart Sets a Bearish-Neutral Bias
The daily chart shows a bearish-neutral bias with price pinned below all three major moving averages. The 20-EMA at $1.73 sits below the 50-EMA at $1.83, and price at $1.63 trades beneath both as well as the 200-EMA at $1.79. Crucially, the 50 remains above the 200 — the longer-term framework has not fully rolled over — but the medium-term structure has broken down. Read this as a market that lost its higher range and has not yet earned the right to be called a downtrend, only a failed uptrend. Until $1.73 is reclaimed and held, rallies remain corrective by default.
Daily RSI at 38.02 fits that reading without signaling panic. It is weak and below the midline but not oversold — there is no capitulation signature here, just persistent absorption of bids. Momentum has cooled rather than broken. MACD reinforces this clearly: line at -0.07, signal at -0.07, histogram flat at zero. The downward impulse has fully stalled, which is the fingerprint of a bear trend that ran out of sellers, not one that found buyers. These are very different conditions, and traders conflate them constantly.
Bollinger bands frame the range that matters: midline $1.74, upper $1.96, lower $1.53. Price at $1.63 sits in the lower half, closer to the floor than the mean. The $1.53 band and the $1.73–$1.74 confluence with the 20-EMA act as the two magnets. Daily ATR of $0.08 means a normal session can cover roughly half that distance — this range is one or two decent trend days from resolving in either direction. In parallel, daily pivots tighten the near-term battlefield: PP $1.62, R1 $1.65, S1 $1.60. Holding above $1.62 keeps the intraday bid intact; losing $1.60 hands control back to sellers with $1.53 as the next logical target.
A Genuine but Fragile Recovery Attempt on the Hourly Chart
The 1H chart, however, challenges the bearish daily bias directly. Price at $1.63 is above the 20-EMA ($1.62) and level with the 50-EMA ($1.63), but still capped by the 200-EMA at $1.68. The short-term downtrend has been neutralized, though the medium-term hourly ceiling remains untouched. RSI at 60.51 shows real buying pressure, and the MACD histogram at 0.01 with line and signal flat at zero marks the moment a bearish cycle flips to neutral. Hourly bands are tight — $1.58 to $1.64 around a $1.61 mid — with price riding the upper edge. In a low-ATR environment ($0.01), this tends to precede either a breakout or a fast rejection rather than a slow grind.
Meanwhile, on the 15-minute chart, all three EMAs ($1.63, $1.62, $1.63) are stacked on top of each other at price. RSI at 64.30 is the hottest reading across timeframes, MACD is marginally positive with a flat histogram, and the upper band sits at $1.64. This is an execution chart, not a bias-setting one. The immediate decision point is $1.64. A clean acceptance above it gives short-term longs a defined structure. A rejection there, with RSI already in the mid-60s on the smallest timeframe, is exactly how intraday traps are built inside a broken daily.