

The XRP price lost the $1.50 mark on Monday morning, trading around $1.47 after a 2.9% daily drop. That is not the end of the world, but it is an important level, and the way $XRP behaves around it will decide the whole week. Here is what the chart is telling us.
XRP Price Drops Below $1.50: Where Is Ripple Heading This Week?
The XRP price lost the $1.50 mark on Monday morning, trading around $1.47 after a 2.9% daily drop. That is not the end of the world, but it is an important level, and the way $XRP behaves around it will decide the whole week. Here is…
CryptoTicker
Publisher
Sep 28, 2026 at 8:47 AM UTC · 3 分で読める
Key Signal
$1.47 XRP trading price
Entities
xrp
Market Impact
XRP+0.84%$1.5
Last Updated
3日前
Why Did the XRP Price Drop Below $1.50?
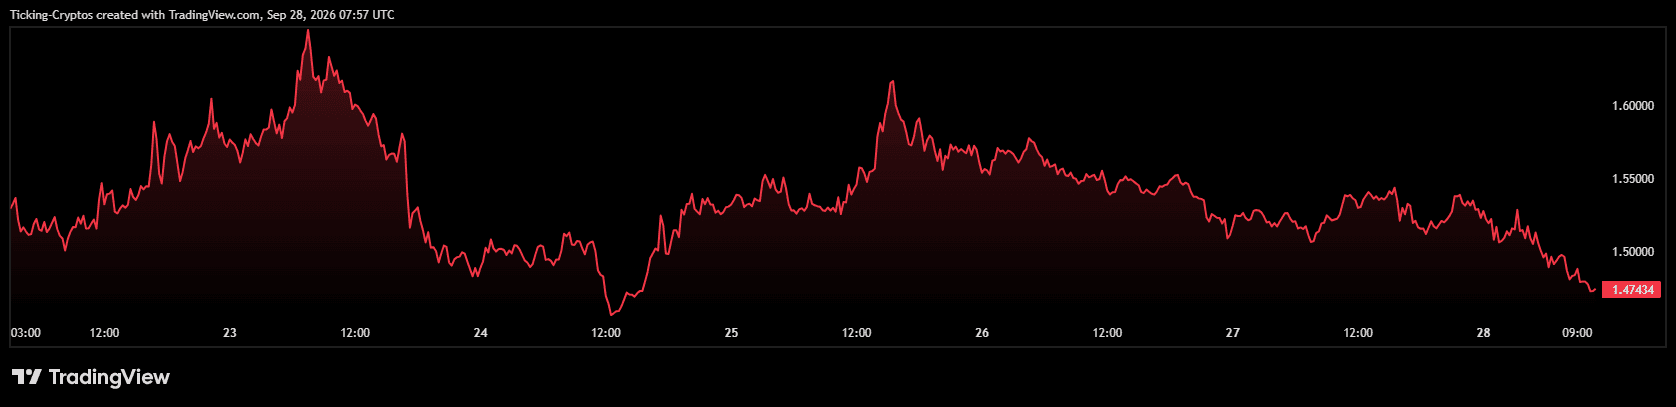
Zoom in on the last seven days and the picture is clear: XRP has been printing lower highs since the local peak near $1.63 on September 23. A second attempt at $1.60 on September 25 failed as well, and since then the price has been bleeding slowly, from $1.55 to $1.52 to $1.50, and now $1.47.
Nothing dramatic happened on any single day. This is the kind of sell-off where buyers simply do not show up, and every small bounce gets sold. After the strong rally in early September, some cooling was overdue, and the market is now testing whether $1.50 is real support or just a number.
Check the live crypto prices on CryptoTicker to follow the move in real time.
What Does the Daily XRP Chart Show?
The bigger picture is more constructive than the weekly candles suggest.
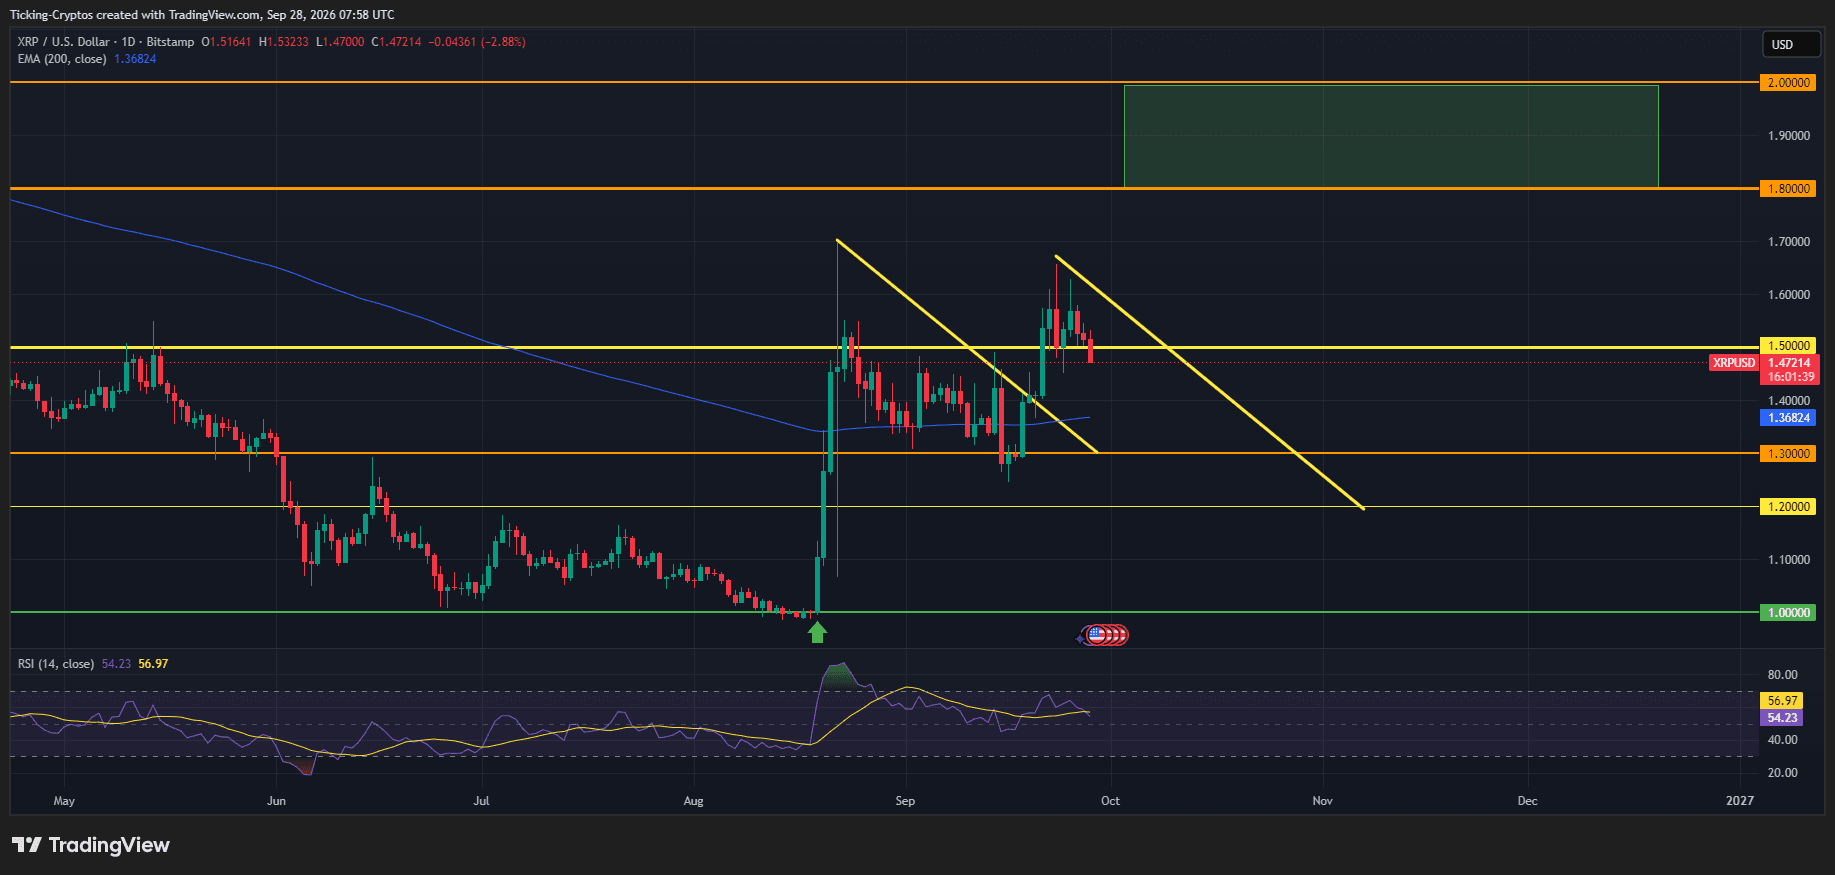
Three things stand out on the daily chart:
- XRP is still above the 200-day EMA. The long-term average sits at $1.37, and it is now curling upward for the first time since spring. As long as XRP stays above it, the medium-term trend remains bullish.
- The first downtrend line is already broken. The descending trendline from the late-August spike to $1.70 was cleared in mid-September when XRP pushed back above $1.50. That breakout is what triggered the rally to $1.67.
- A second downtrend line is now in play. From the September 23 high, a new descending line runs toward $1.20 by mid-November. The current pullback is happening right under it. For the bulls, breaking this line is the job for October.
Market Context
Article Intelligence
Key Entities
Sponsored
Ad
NewsLayerLearn more
NewsLayer Premium
Unlock deeper intelligence.
Ad-free reading, exclusive research, and real-time onchain insights.
Go Premium