

Ahead of the FOMC rate decision, markets were all over the place, as traders largely sat on their hands and awaited the release the Fed’s policy statement and hear from Chairman Kevin Warsh. Still disappointed from yesterday’s news that the CLARTY Act, a digital-asset market-structure bill, failed to clear the threshold required to advance to full Senate consideration, crypto traders were not in the mood to buy the dip. But what are the charts telling us?
Bitcoin technical analysis: Markets await FOMC decision
Ahead of the FOMC rate decision, markets were all over the place, as traders largely sat on their hands and awaited the release the Fed’s policy statement and hear from Chairman Kevin Warsh. Still disappointed from yesterday’s news that…
FOREX.com
Publisher
Sep 16, 2026 at 4:26 PM UTC · Updated 2일 전 · 2 분 소요

Key Signal
$80K-$82K Key Bitcoin resistance zone
Entities
bitcoin
Market Impact
BTC+1.82%$77,889
Last Updated
2일 전
번역 중…
Bitcoin technical analysis
Well, the chart of Bitcoin is not looking particularly promising after it ended weeks of consolidation with a breakdown yesterday. The clue for the breakdown came when bitcoin made a failed attempt to break higher in early September when that key $80K-$82K resistance held and that triggered some unwinding of longs, leading to an eventual drop below support near $76.2K. This level was being tested now from underneath at the time of writing.
Yesterday saw Bitcoin completely give up Monday’s entire gains and some. At one point on Monday, it looked like the cryptocurrency was about to stage a breakout when it rallied above $79K, but here it ran into some resistance later on in that session, leading to a pullback from the highs.
Market Context
Bitcoin
BTC
$77,873
+1.80% (24H)
Market Cap
$1.56T
24H Volume
$20.7B
24H High
$77,992
Article Intelligence
Key Entities
Related Coverage
 CryptoBitcoin Holds Key Averages as ETH and XRP Test Barriers한 시간 전 · 3 min read
 CryptoBitcoin Rises Following Tech-Fueled Gains on Wall Street -- Market Talk한 시간 전 · 1 min read
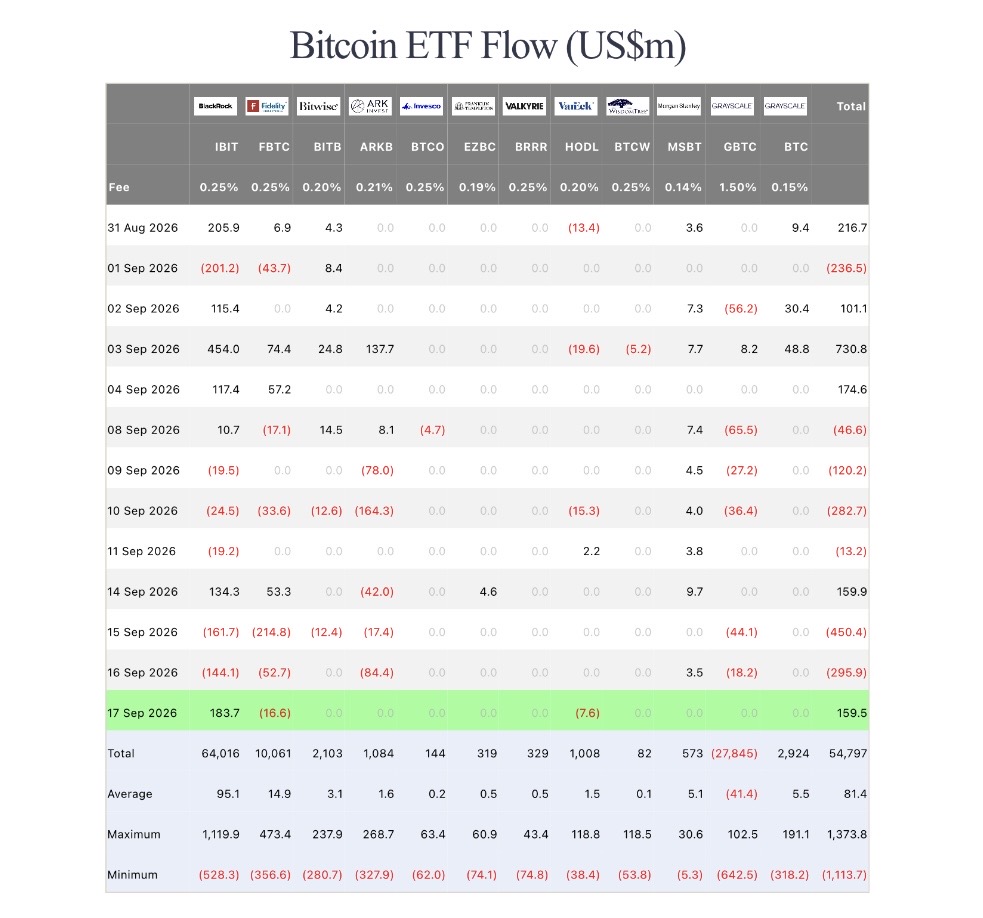 Crypto🚨𝗝𝗨𝗦𝗧 𝗜𝗡:🇺🇸 Bitcoin spot ETFs recorded a net inflow of $159.5M on September 17.한 시간 전 · 1 min read
Sponsored
Ad
NewsLayerLearn more
NewsLayer Premium
Unlock deeper intelligence.
Ad-free reading, exclusive research, and real-time onchain insights.
Go Premium