
2026.09.15
Crypto Fear and Greed Index: What the Number Means
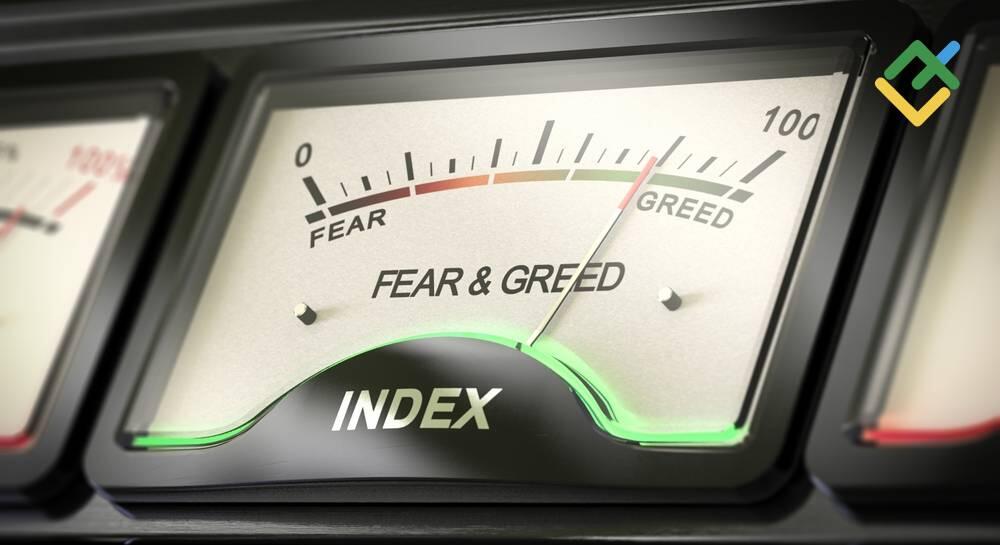
The Crypto Fear and Greed Index is the best-known measure of sentiment in the crypto market. It reads the mood of the crypto community and puts it on a scale from 0 to 100. The number comes from six weighted inputs such as volatility,…
LiteFinance
Publisher
Sep 15, 2026 at 3:42 PM UTC · 10 분 소요
Key Signal
0-100 sentiment score range
Market Impact
BTC-0.52%$75,496
Last Updated
하루 전
2026.09.15
What Is the Crypto Fear and Greed Index?Maxim Tkachenkohttps://www.litefinance.org/blog/authors/maxim-tkachenko/
The Crypto Fear and Greed Index is the best-known measure of sentiment in the crypto market. It reads the mood of the crypto community and puts it on a scale from 0 to 100. The number comes from six weighted inputs such as volatility, trading volume, momentum, surveys, social media activity, and Google Trends data. Together, they turn scattered signals into one figure that millions of crypto investors check before they trade.
The Crypto Fear and Greed Index does not predict prices, but it captures investor sentiment at the current moment. That is why reading it correctly turns the index into a practical risk management tool. Ignoring it deprives traders of an extra source of information about cryptocurrency market conditions.
The article covers the following subjects:
Major Takeaways
- The index rates market mood from 0 to 100, where 0 is extreme fear, and 100 is extreme greed. The number is not a vague estimate. It is calculated from six separate indicators.
- The index is calculated from six components: volatility (25%), market momentum and volume (25%), social media (15%), surveys (15%), Bitcoin dominance (10%), and Google Trends data (10%). Each component is compared with the corresponding average values for the last 30 and 90 days.
- Extreme values carry the most signal. The extreme fear zone (0–24) has historically indicated oversold conditions and buying opportunities, while the extreme greed zone (75–100) has pointed to overbought conditions. In turbulent markets, though, these readings can last far longer than most traders expect.
- The index shows where the market is now, not where it is going. When it comes to predicting the next day, the index is right about 49% of the time, which is close to random.
- The index updates every 12–24 hours, depending on the provider. Always check the countdown to the next update on the index panel to be sure the reading is current before you open a crypto trade.
- In 2026, the index fell to a record low of 5, below both the COVID crash (8) and the FTX collapse (12). That reading was a clear sign of capitulation across the broad market.
- Since 2018, the market has spent about 62% of the time in the fear zone. Crypto simply runs on fear, and greed shows up only in brief bursts when a bull run takes hold.
Market Context
Bitcoin
BTC
$75,496
-0.52% (24H)
Market Cap
$1.52T
24H Volume
$27.7B
24H High
$77,321
Article Intelligence
Sponsored
Ad
NewsLayerLearn more
NewsLayer Premium
Unlock deeper intelligence.
Ad-free reading, exclusive research, and real-time onchain insights.
Go Premium