
The Graph [GRT] has shed 8.5% in the past 24 hours as Bitcoin [BTC] faced a correction from $87.4k to $83k. Yet, over the past week, the altcoin has rallied 37.7%. The Altcoin Index was at 51 at the time of writing.
GRT crypto pulls back 8.5% – Is $0.020 The Graph’s next buy zone?
The Graph [GRT] has shed 8.5% in the past 24 hours as Bitcoin [BTC] faced a correction from $87.4k to $83k. Yet, over the past week, the altcoin has rallied 37.7%. The Altcoin Index was at 51 at the time of writing.
AMBCrypto
Publisher
Sep 24, 2026 at 1:15 PM UTC · 2 분 소요

Market Impact
BTC-0.38%$83,933
Last Updated
하루 전
번역 중…
Tether Dominance has fallen from 8.5% in mid-August to 6.52% at the time of writing. Notably, Bitcoin Dominance has declined in September, too, pointing to capital flow into altcoins and a risk-on short-term outlook from crypto market participants.
As a result of this bullish sentiment, GRT crypto has made sizable gains since forming the swing low at $0.013 in August. In five weeks, GRT crypto has rallied 90% from the previous month’s swing low.
Has GRT crypto’s long-term trend shifted bullishly?
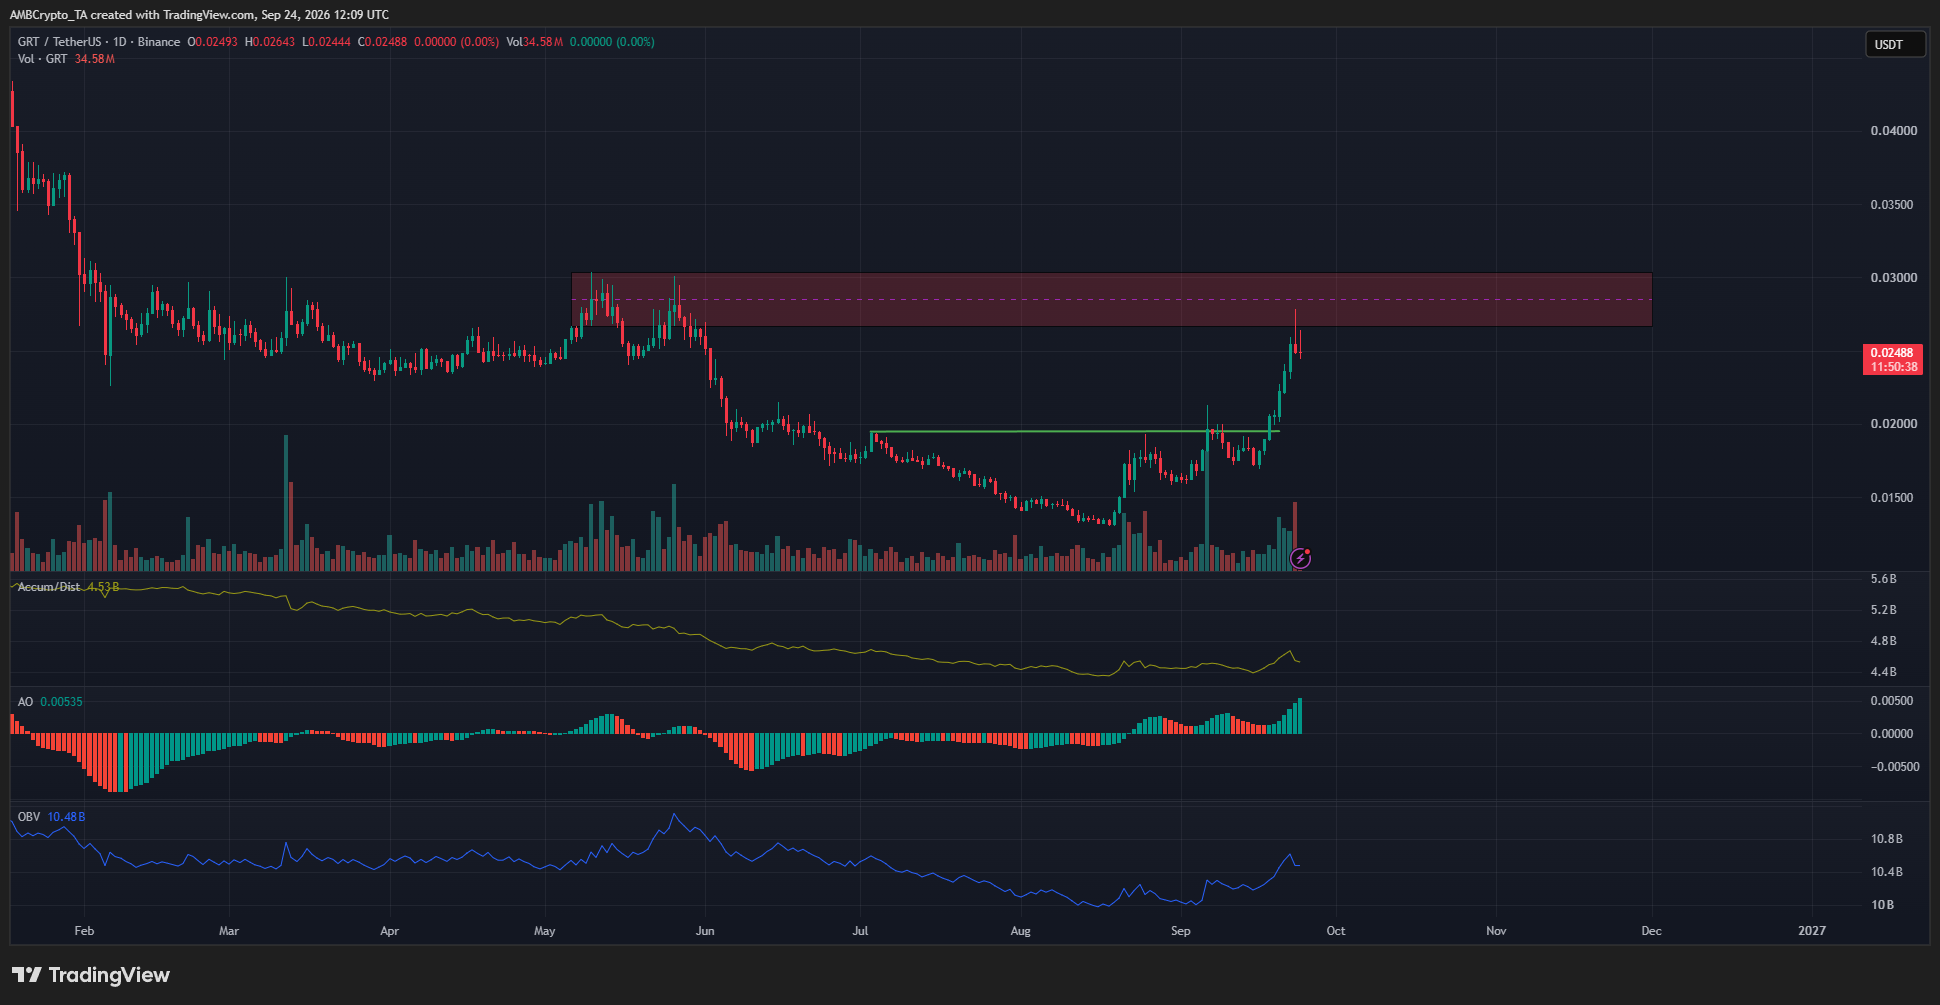
Technically, the GRT crypto trend shifted bullishly when the downtrend’s most recent lower high at $0.01947 (green) was breached on the 6th of September. However, the $0.023-$0.030 area was a consolidation phase from earlier in 2026 that cannot be ignored.
The GRT tokens bought during this consolidation ahead of a recovery would only now be nearing or slightly surpassing their breakeven prices. Hence, it is a particularly strong supply zone.
Moreover, the bearish order block (red) at $0.026-$0.30 is one to watch. A daily session close above $0.030 would be a reliable signal of bullish dominance.
Market Context
Bitcoin
BTC
$83,929
-0.39% (24H)
Market Cap
$1.69T
24H Volume
$25.7B
24H High
$85,247
Article Intelligence
Topics
Sponsored
Ad
NewsLayerLearn more
NewsLayer Premium
Unlock deeper intelligence.
Ad-free reading, exclusive research, and real-time onchain insights.
Go Premium