
NEAR Price Climbs as Bitwise ETF Gets Green Light: $155 Target Sparks Fresh Rally
The bigger development came with Bitwise’s newly released 39-page $NEAR investment report, co-authored by Bitwise CIO Matt Hougan.
Cryptonews.net
Publisher
Sep 28, 2026 at 12:02 PM UTC · 2 분 소요

Market Impact
Total MCap-0.95%
Last Updated
2일 전
번역 중…
The bigger development came with Bitwise’s newly released 39-page $NEAR investment report, co-authored by Bitwise CIO Matt Hougan.
The base case for $NEAR is $150+.
— Michaël van de Poppe (@CryptoMichNL) September 26, 2026
The bull case for $NEAR is $550+.
I don't think we're bullish enough on crypto for the coming years. https://t.co/b8pS0pgr5i
The $155 base case would represent a dramatic increase from $NEAR’s current price around $5.33. The extreme bullish scenario reaches $562. Bitwise’s bear case, meanwhile, shows that the firm’s model also accounts for substantial downside if its adoption assumptions fail.
In the bullish scenario, Bitwise compares $NEAR’s potential role in the emerging digital economy with established payment networks, including Visa. The report cites Visa’s $15.7 trillion payment volume in 2024 as part of its valuation framework.
$NEAR Price Analysis: Can the Breakout Reach $6?
The weekly $NEAR/USDT price chart shows a decisive breakout from a multi-year descending trendline. $NEAR spent much of 2025 and 2026 below the trendline while repeatedly forming lower highs. The latest rally has broken above that structure with a sharp increase in volume.
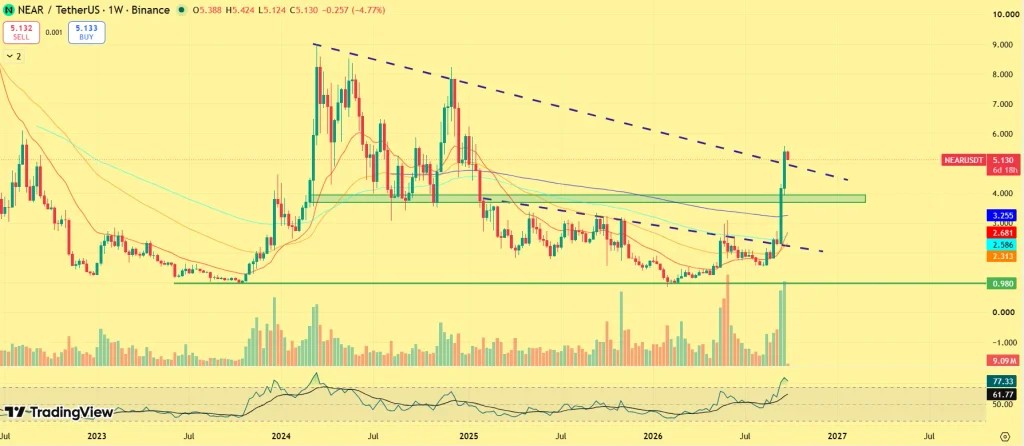
$NEAR token price has also moved through the $4.40–$4.60 resistance zone marked on the chart. With $NEAR now around $5.30, the immediate technical hurdle sits near $5.50–$5.75. A sustained move above $5.75 would put $6 into focus. Beyond $6, the weekly chart leaves room toward the $7–$8 area, where previous supply could emerge. On the downside, $4.40–$4.60 is now the key breakout-support zone. Holding above this region would keep the long-term breakout structure intact. A weekly rejection back below it would weaken the setup and expose the next support around $3.80–$4.00.
Market Context
Article Intelligence
Sponsored
Ad
NewsLayerLearn more
NewsLayer Premium
Unlock deeper intelligence.
Ad-free reading, exclusive research, and real-time onchain insights.
Go Premium