


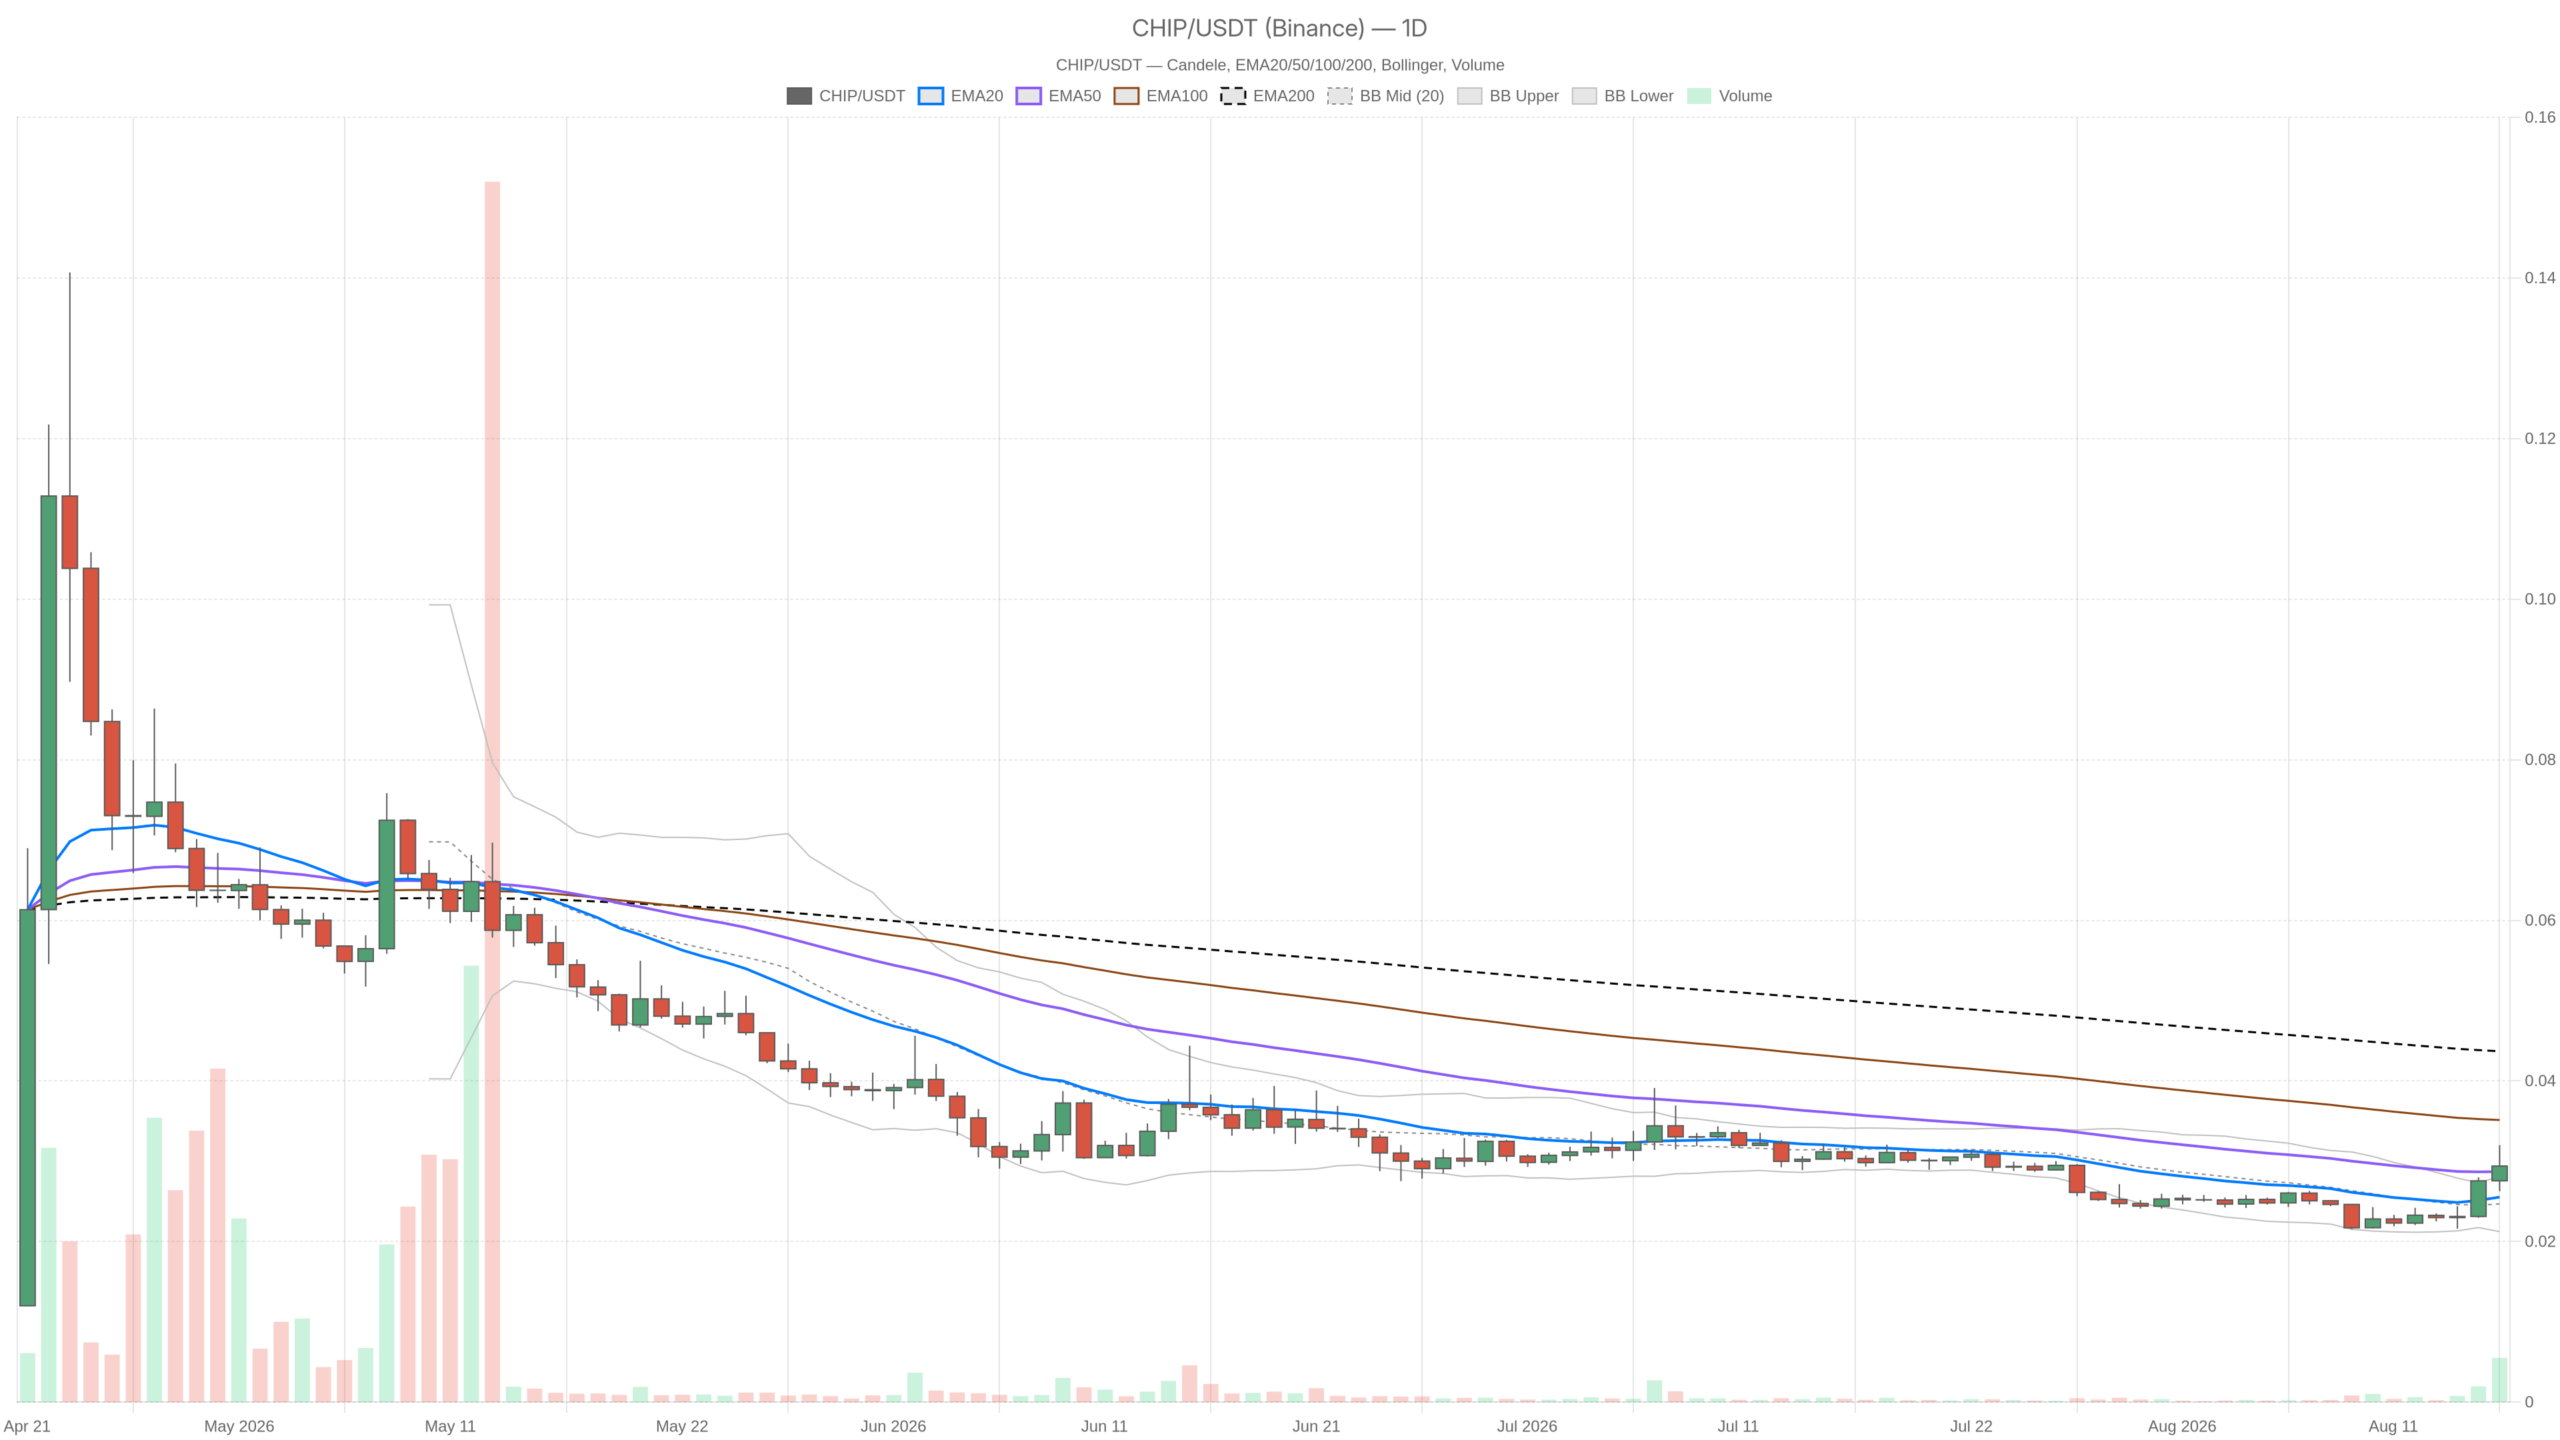
As of August 16, 2026, CHIP — the ticker for USD.AI crypto — sits at $0.03 against USDT, caught between a daily chart that remains unresolved and an hourly structure that is leaning clearly bullish. That gap between timeframes is the whole story right now.
USD.AI Crypto Analysis: Short-Term Bullish Momentum Meets Daily Trend Uncertainty
As of August 16, 2026, CHIP — the ticker for USD.AI crypto — sits at $0.03 against USDT, caught between a daily chart that remains unresolved and an hourly structure that is leaning clearly bullish. That gap between timeframes is the…
The Cryptonomist
Publisher
Aug 16, 2026 at 8:38 PM UTC · 7 분 소요
Market Impact
BTC+7.38%$69,027
Last Updated
3일 전
번역 중…
Key takeaways
- CHIP trades at $0.03, remaining below the daily EMA200 at $0.04 despite a constructive short-term structure.
- RSI momentum is fading across timeframes: daily at 61.11, hourly at 59.84, and 15-minute at 58.05.
- Pivot support and resistance levels cluster tightly around $0.03, signaling compressed volatility ahead of a potential breakout.
- The Fear & Greed Index reads 34 with Bitcoin dominance at 56.14%, indicating defensive capital positioning across the market.
- A daily close above the EMA200 at $0.04 would flip the macro bias bullish; a slide below the hourly EMA200 at $0.02 would invalidate the bounce.
Daily Bias: Neutral With Unfinished Business Below EMA200
The daily chart remains neutral because price at $0.03 sits below the EMA200 at $0.04, even though short-term averages have now converged. Price is sandwiched right at the EMA20 and EMA50, both at $0.03, but the long-term average has not been reclaimed. Until that gap closes, calling this an established uptrend would be premature.
Market Context
Bitcoin
BTC
$69,027
+7.38% (24H)
Market Cap
$1.39T
24H Volume
$41.2B
24H High
$70,002
Article Intelligence
Key Entities
Sponsored
Ad
NewsLayerLearn more
NewsLayer Premium
Unlock deeper intelligence.
Ad-free reading, exclusive research, and real-time onchain insights.
Go Premium