
Bitcoin (BTC) is showing strong signs that its latest long-term floor is already in, according to a classic trading indicator.
Bitcoin adds to bull-market hopes as price metric prints fourth-ever bullish cross
The Fisher Transform indicator produced a rare crossover for only the fourth time in Bitcoin’s history.
Cointelegraph by William Suberg
Publisher Cointelegraph
Sep 18, 2026 at 10:46 AM UTC · 3 min de leitura
Entities
bitcoin
Market Impact
BTC+0.66%$81,445
Last Updated
há um dia
Traduzindo…
Key points:
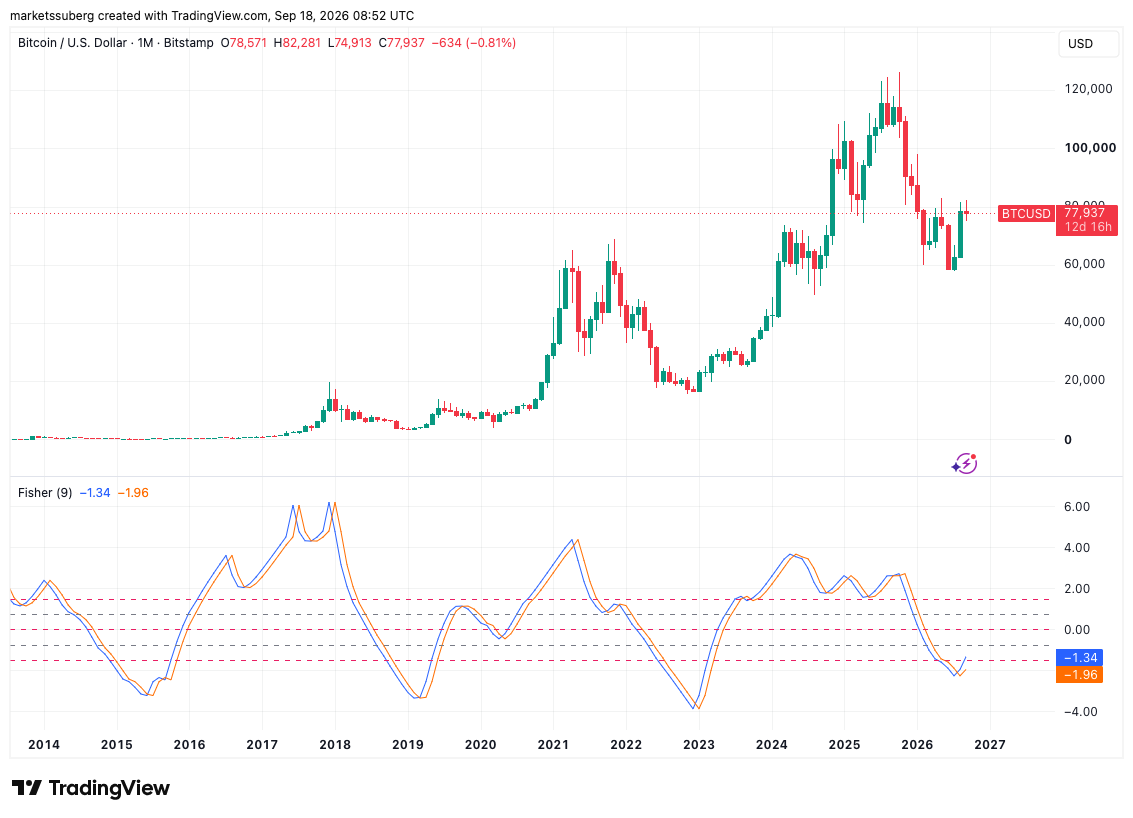
- In August, the Fisher Transform indicator delivered a monthly bullish crossover for only the fourth time in Bitcoin’s history, according to Willy Woo.
- Previous monthly crossovers accompanied the end of Bitcoin bear markets, including in late 2022, when the Fisher Transform Indicator hit -3.83.
- A bullish divergence continued on weekly time frames, echoing the closing stages of the 2022 BTC price downtrend.
Analyst sees evidence of clean BTC price reversal
In an X thread on Friday, analyst Willy Woo flagged key readings from the Fisher Transform indicator, a price trend analysis tool created in 2002.
The indicator smooths an asset’s price action to create a readable trend-strength chart. Market prices tend to spend more time around extreme values than ordinary statistical data. The Fisher transform corrects this by applying a log-based transform.
The indicator is formed of two trend lines, the Fisher line and the trigger line, that fluctuate on a scale with zero at its center. The trigger line is derived from the Fisher line, plotted with a delay of one period.
Market Context
Bitcoin
BTC
$81,449
+0.67% (24H)
Market Cap
$1.63T
Circulating Supply
20.1M BTC
24H Volume
$26.9B
24H High
$81,915
Article Intelligence
Key Entities
Related Coverage
 CryptoBitcoin Bull Says Cancer Took Both Parents By 18, Thought He’d Die Young Too—Until He 'Uncovered a Hack'há uma hora · 1 min read
 CryptoCrypto News: Bitcoin Holds $81K After Fed Hike as Smart Money Moves Into Pepetohá uma hora · 4 min read
Sponsored
Ad
NewsLayerLearn more
NewsLayer Premium
Unlock deeper intelligence.
Ad-free reading, exclusive research, and real-time onchain insights.
Go Premium