
The Bitcoin Rainbow Chart suggests $BTC remains in historically undervalued territory heading into October 2026, with the cryptocurrency trading just above the model’s lowest valuation zone.
Bitcoin Rainbow Chart predicts BTC price for start of October 2026
The Bitcoin Rainbow Chart suggests $BTC remains in historically undervalued territory heading into October 2026, with the cryptocurrency trading just above the model’s lowest valuation zone.
Cryptonews.net
Publisher
Sep 22, 2026 at 12:24 PM UTC · 2 min de leitura

Entities
bitcoin
Market Impact
BTC-0.83%$86,265
Last Updated
há 8 horas
Traduzindo…
The Bitcoin Rainbow Chart is a long-term valuation model that uses logarithmic bands to show whether Bitcoin is trading in zones historically associated with accumulation, fair value, or market euphoria.
At press time, Bitcoin ($BTC) was trading at $86,128, only slightly above the Rainbow Chart’s “Bitcoin is dead” band, projected at $84,124.72 for October 2, 2026.
According to the BlockchainCenter Rainbow Chart, the lowest band for October 2, labeled “Bitcoin is dead,” stands at $84,124.72. The next level, “Basically a Fire Sale,” is projected at $112,145.39, followed by the “BUY!” band at $149,519.46 and the “Accumulate” zone at $203,456.75.
Further up the scale, the “Still cheap” band is positioned at $279,713.75, while the “HODL!” zone sits at $385,875.50. Above these levels, the model enters increasingly speculative territory, with the “Is this a bubble?” band at $531,713.42, “FOMO intensifies” at $712,913.64, and “Sell. Seriously, SELL!” at $970,822.48.
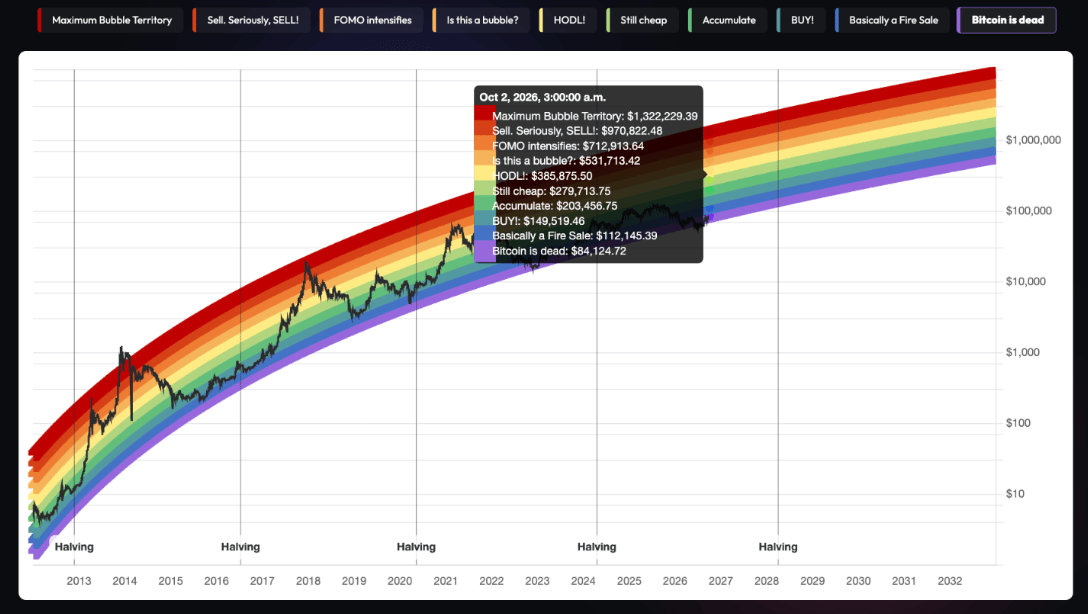
At the top of the model sits the “Maximum Bubble Territory” band at $1.32 million. Historically, the upper red bands have coincided with periods of extreme optimism and cycle peaks, while the lower blue and purple zones have been associated with bearish sentiment and long-term accumulation.
Market Context
Bitcoin
BTC
$86,248
-0.85% (24H)
Market Cap
$1.73T
24H Volume
$33.3B
24H High
$87,447
Article Intelligence
Key Entities
Related Coverage
 CryptoBitcoin price reclaims $85K as $612M shorts get liquidated – Can BTC hold?há 2 horas · 2 min read
 CryptoBitcoin ETFs Just Posted Their Biggest Inflow Since the October Record, Nearly $1 Billion in One Dayhá 2 horas · 1 min read
 CryptoBitcoin Investors Buy Nearly $1B in BTC ETFs as Bull Market Returnshá 11 minutos · 1 min read
Sponsored
Ad
NewsLayerLearn more
NewsLayer Premium
Unlock deeper intelligence.
Ad-free reading, exclusive research, and real-time onchain insights.
Go Premium