
Bitcoin has had quite a run of late vs. the U.S. dollar, rising some 40% between its June 30 low and its Aug. 27 high before pulling back some. Is this parabolic run rally over? Let's see what Bitcoin's chart says.
Bitcoin Rose 40%+ in Two Months. What Its Chart Says Now
Bitcoin has had quite a run of late vs. the U.S. dollar, rising some 40% between its June 30 low and its Aug. 27 high before pulling back some. Is this parabolic run rally over? Let's see what Bitcoin's chart says.
Moomoo
Publisher
Sep 1, 2026 at 1:47 PM UTC · 3 min de leitura
Entities
bitcoin
Market Impact
BTC-2.30%$77,208
Last Updated
há 4 horas
Traduzindo…
However, both have moved sideways or lower in recent days.
Bitcoin's Technical Analysis
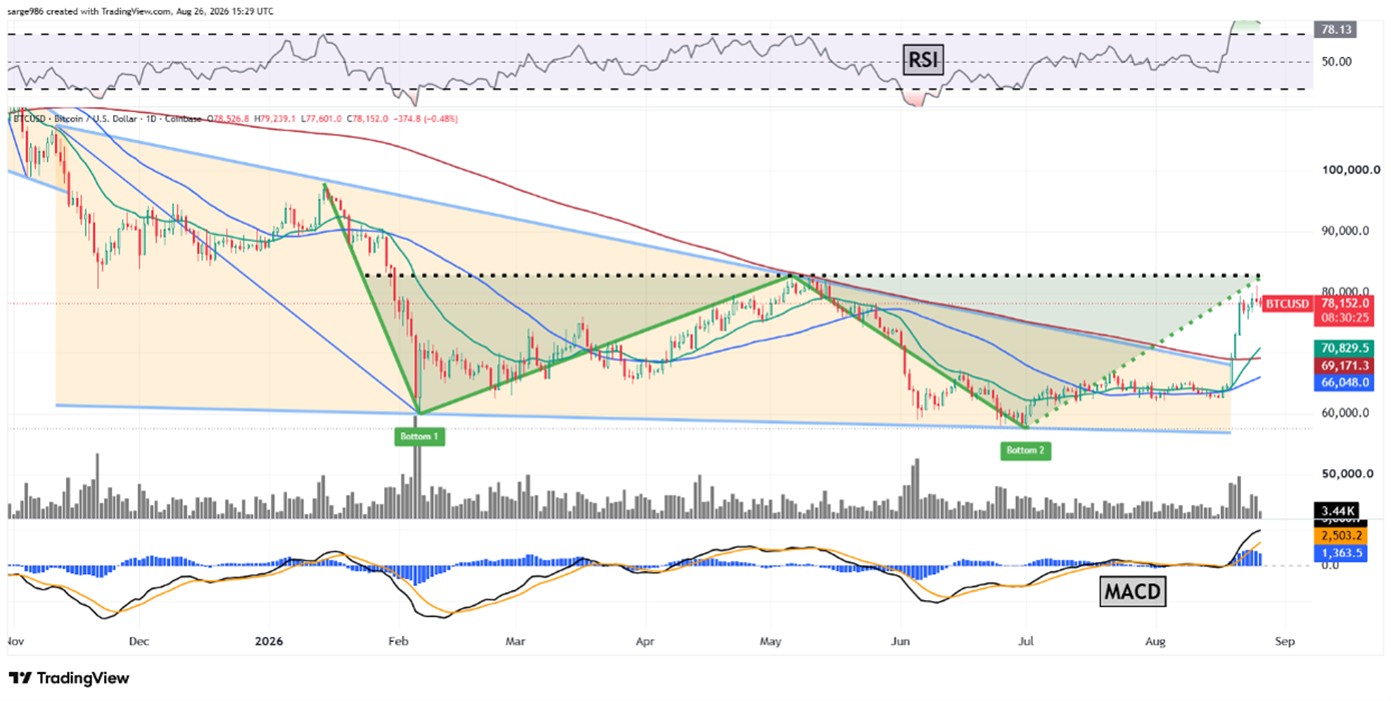
Now let's check out Bitcoin's trading level against the U.S. dollar using pricing data from Coinbase (COIN). Here's Bitcoin's chart going back some 10 months and running through Wednesday afternoon (Aug. 26):
Readers will see two concurrent technical patterns for Bitcoin that appear on the surface to both be bullish.
First, there's a falling-wedge pattern of bullish reversal, marked in tan at the chart's left and center. This created Bitcoin's August breakout, which validated the pattern.
Second, Bitcoin's chart is now showing a giant double-bottom pattern, marked with green shading at the chart's center and right. Like the falling wedge, this is also a pattern of bullish reversal.
The problem here is that the double-bottom pattern's pivot (central apex) is at just about $81,700 – close to where BTC appears to have hit resistance in late August. (Bitcoin peaked at $81,442.02 last Thursday on Coinbase and was trading at $78,977.78 Tuesday morning.)
Market Context
Bitcoin
BTC
$77,208
-2.30% (24H)
Market Cap
$1.55T
24H Volume
$25.1B
24H High
$79,253
Article Intelligence
Key Entities
Topics
Related Coverage
 CryptoWhat's driving Gold's decline as Bitcoin consolidates?há 2 horas · 1 min read
 MarketsBitcoin ETF Net Inflows Resume -- Market Talkhá 2 horas · 1 min read
 CryptoCrypto ETFs Enter a New Phase in September: Here’s What Investors Should Watchhá 3 horas · 11 min read
Sponsored
Ad
NewsLayerLearn more
NewsLayer Premium
Unlock deeper intelligence.
Ad-free reading, exclusive research, and real-time onchain insights.
Go Premium