

NewsLayer

Install NewsLayer

Get the app experience — one tap from your home screen, instant loads and breaking-news alerts.

NewsLayer.com
LatestDaily BriefMarkets
NewsLayer PulseLIVE₿BTC$74,719-0.62%ΞETH$2,116-1.28%◎SOL$85.88-2.32%✕XRP$1.09-2.13%ÐDOGE$0.0696-0.52%₳ADA$0.1769-0.67%Total Cap$2.61T-0.96%24H Vol$111.0BLayer Index34 Fear
BreakingBinance Hack Launderers Mint Elon Musk and Animal Meme Coins to Move Stolen Crypto7 saat önce
Markets
HomeCryptoMarkets

Crypto|Markets

Crypto Market Cap Breakout Signals End of 2026 Accumulation

The crypto market cap is finally moving beyond the accumulation range that has defined much of the year, with total market value around $2.86 trillion. The move comes as the business cycle starts expanding, according to the market…

CryptoRank

Publisher

Sep 30, 2026 at 6:16 PM UTC · 1 dk okuma
Crypto Market Cap Breakout Signals End of 2026 Accumulation
Image via CryptoRank

Market Impact

Total MCap-0.96%

Last Updated

bir ay önce

Çevriliyor…

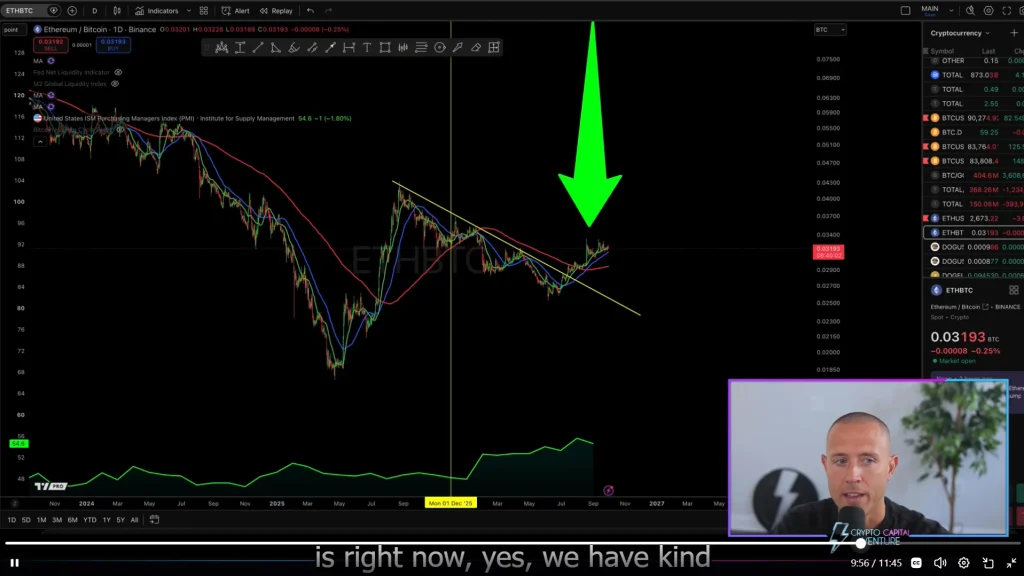
The crypto market cap is finally moving beyond the accumulation range that has defined much of the year, with total market value around $2.86 trillion. The move comes as the business cycle starts expanding, according to the market analysis by an analyst Dan Gambardello.

Crypto Market Cap Moves Beyond Year-Long Range

The latest setup focuses less on CZ’s “Soon…” post and more on what the charts are showing. His September 29 post was heavily reposted across crypto Twitter, but its meaning wasn’t specified.

The bigger signal is the crypto market cap breaking out of its long-running accumulation range. The analysis frames February 2026 as the start of the accumulation phase, with current market-cap action suggesting that sideways trading may be ending.

Reach crypto's most engaged readers — advertise mid-article on NewsLayer
Sponsored

Reach crypto's most engaged readers — advertise mid-article on NewsLayer

NewsLayer

Ad

Ethereum Charts Add Another Layer

Ethereum is also central to the setup, with its accumulation channel and ETH/BTC dynamics forming part of the broader analysis.

The 11-minute market review also examines bearish divergences and compares post-QT conditions in 2019 and 2025. Those comparisons are being used to frame the current market structure rather than relying on a single social-media post. The business cycle expansion is another part of the argument.

Market Context

Ξ

Ethereum

ETH

$2,117

-1.26% (24H)

$2,145$2,118$2,091
3 AM10 AM6 PM2 AM

Market Cap

$258.9B

24H Volume

$8.0B

24H High

$2,154

View Ethereum Market Page

Article Intelligence

Topics

cryptomarkets

Sponsored

Ad
House — Advertise on NewsLayer
NewsLayerLearn more

NewsLayer Premium

Unlock deeper intelligence.

Ad-free reading, exclusive research, and real-time onchain insights.

Go Premium
NewsLayer.com

The front page of the onchain economy. Crypto, Web3 and regulation intelligence — live prices, original research and policy tracking in one layer.

Follow on XTelegram

News

  • Latest News
  • The Daily Brief
  • Crypto
  • DeFi
  • Policy
  • Web3
  • Blockchain
  • Explainers

Markets

  • Market News
  • Layer Index
  • Live Charts
  • DeFi Protocols
  • Regulation Tracker
  • Regulation Radar

Company

  • About NewsLayer
  • Advertise
  • PR Publication
  • Become an Author
  • Our Authors
  • Create Account
  • Sign in

Resources

  • Research
  • NewsLayer Originals
  • My Feed
  • Search
  • AI Sector
  • Quantum Sector

NewsLayer Premium

Read the full layer.

Unlock premium intelligence, original research and an ad-free reading experience.

  • Premium Intelligence briefings
  • Ad-free reading experience
  • Members-only research & data
Go Premium

© 2026 NewsLayer.com — The front page of the onchain economy

Privacy Policy·Terms of Service
NewsLayer

Get the signal, not the noise.

Markets, regulation and onchain intelligence in a 5-minute morning read — plus breaking alerts and Layer Index flips as they happen.

The Daily Brief

Breaking alerts

Index flips

Free · No spam · Unsubscribe anytime