

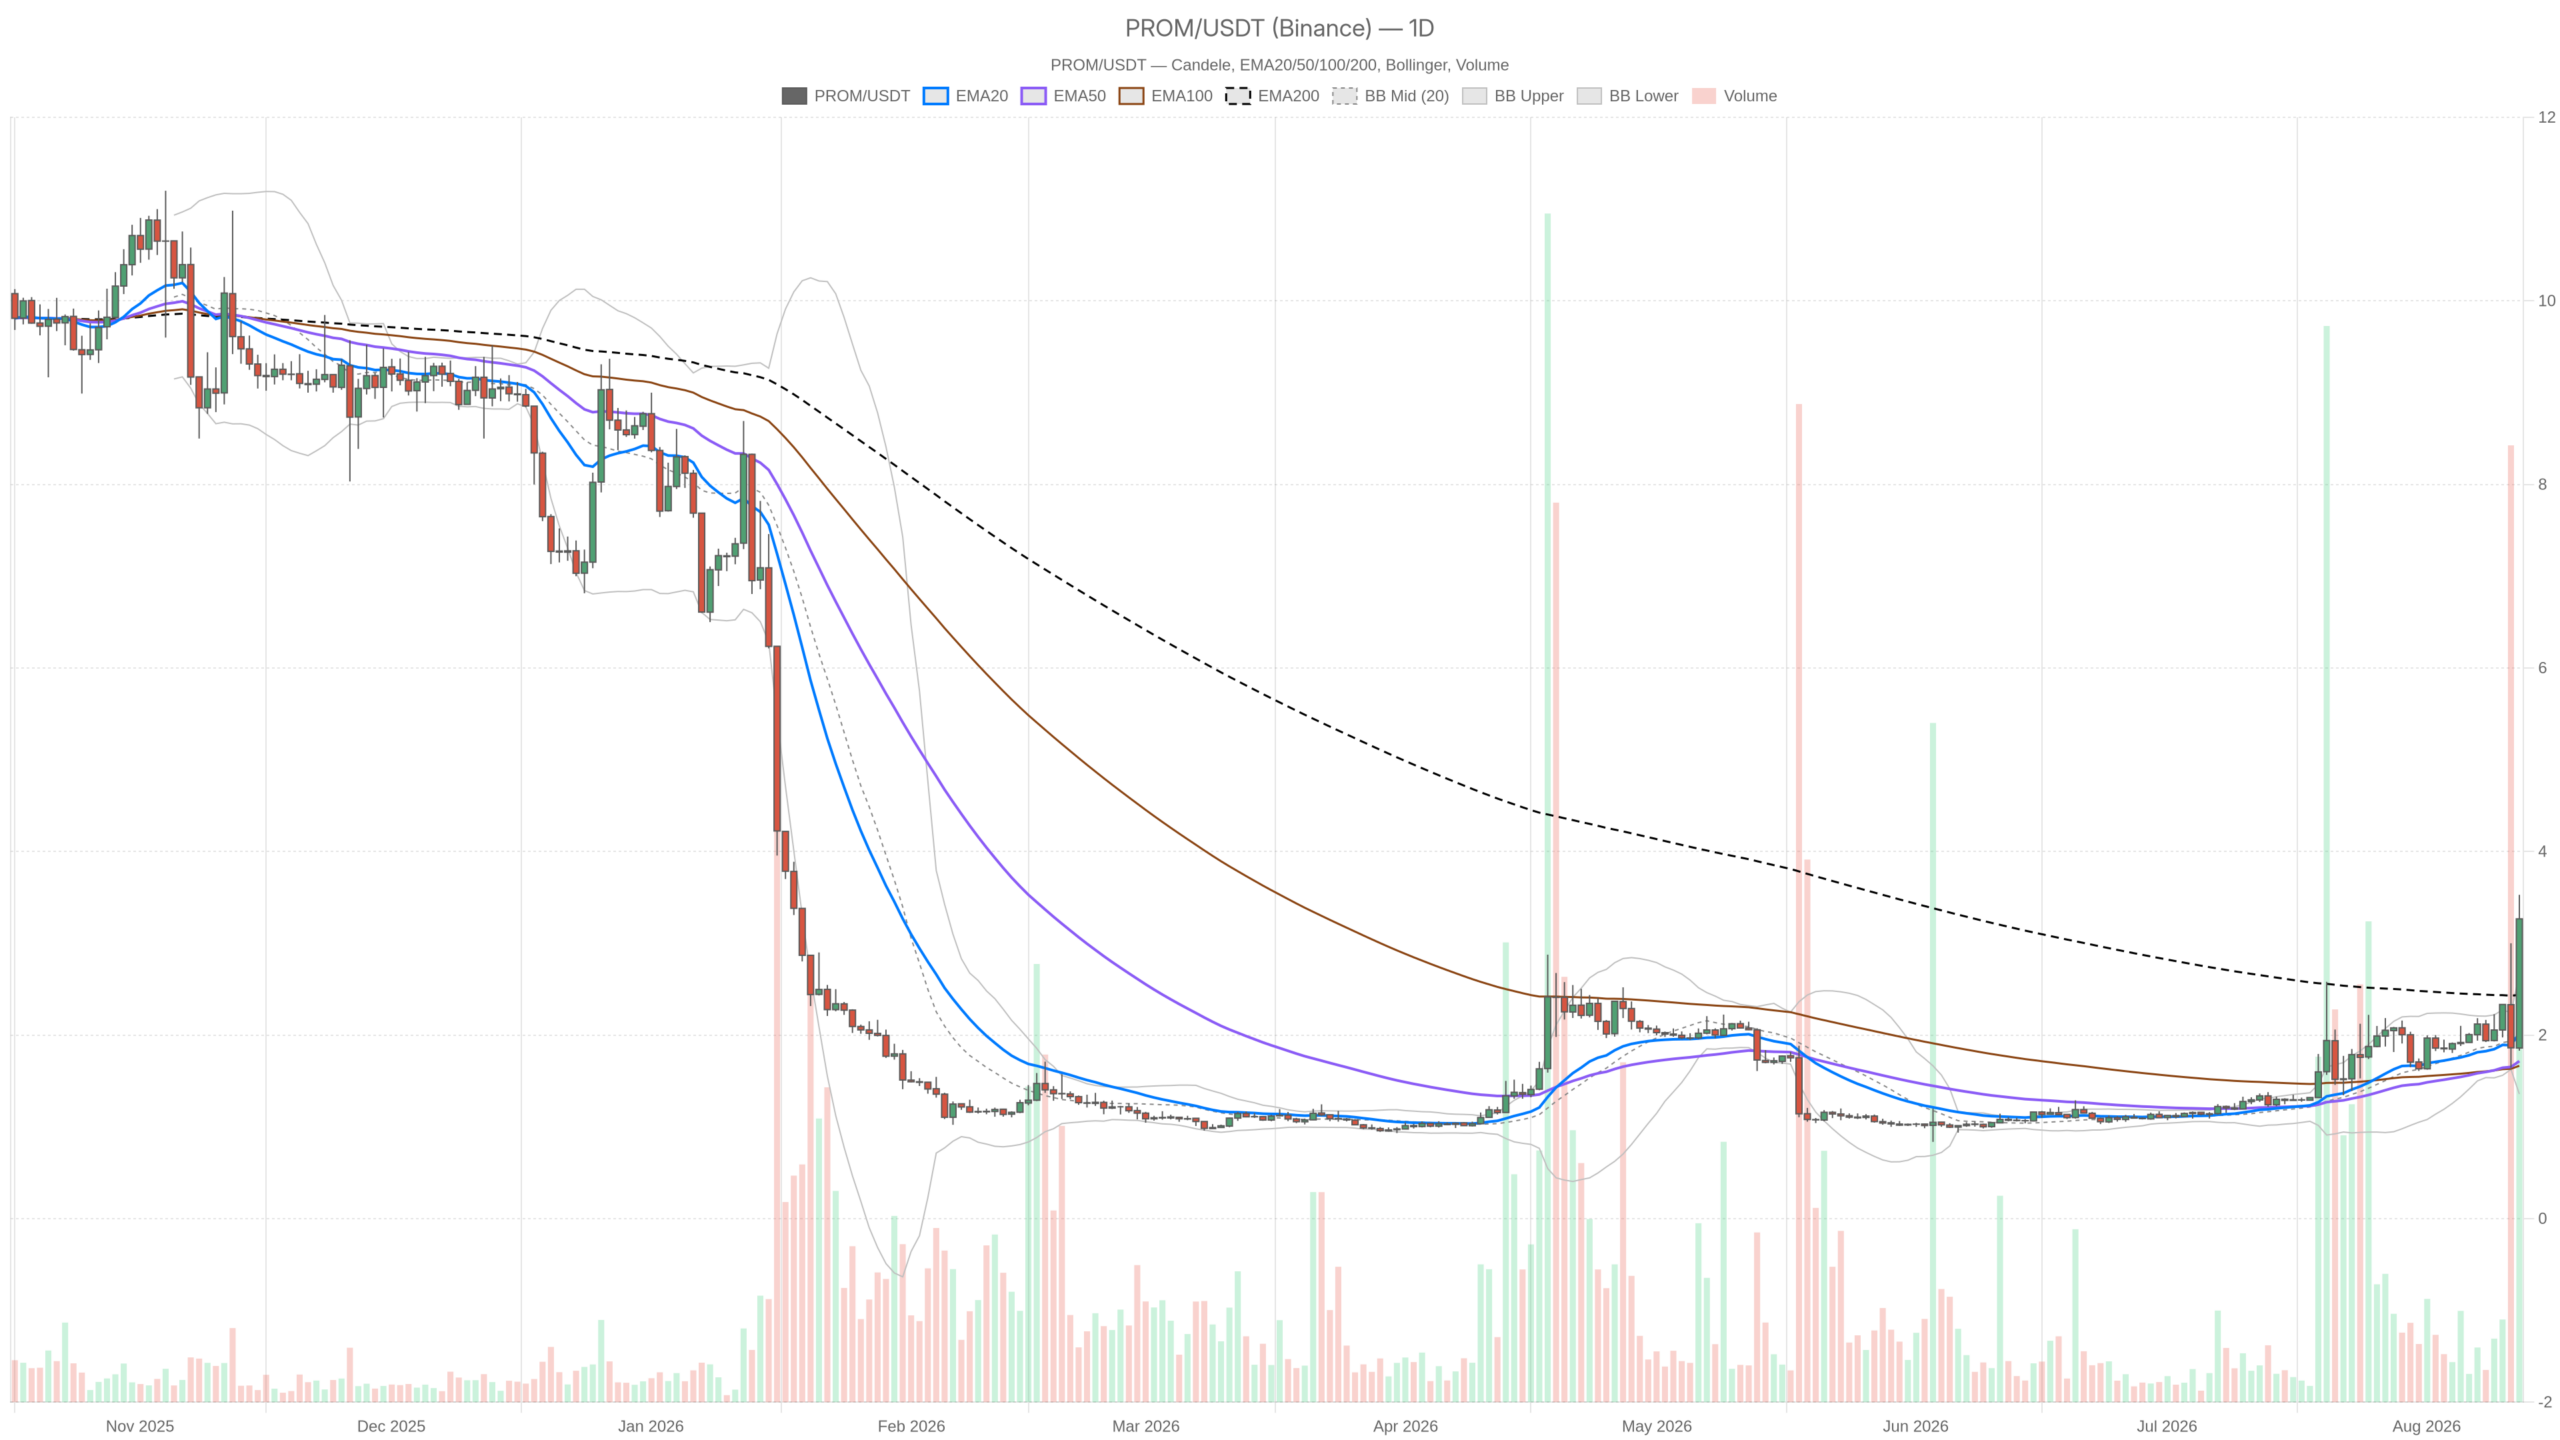
As of August 12, 2026, the broader crypto market sits defensive with Fear at 27 and total market cap barely moving, while Prom crypto stages an isolated vertical breakout. PROMUSDT has surged roughly 62% above its 20-day EMA, printing 3.27 on the daily — a move born of momentum, not structure.
Prom crypto Analysis: Momentum Surge Faces Key Tests in August 2026
As of August 12, 2026, the broader crypto market sits defensive with Fear at 27 and total market cap barely moving, while Prom crypto stages an isolated vertical breakout. PROMUSDT has surged roughly 62% above its 20-day EMA, printing…
The Cryptonomist
Publisher
Aug 12, 2026 at 3:47 AM UTC · Updated bir ay önce · 8 dk okuma
Key Signal
3.27 PROMUSDT daily price
Last Updated
bir ay önce
Çevriliyor…
Key takeaways
- PROMUSDT trades at 3.27, roughly 62% above its 20-day EMA at 2.02, while the Fear & Greed Index sits at 27.
- The daily chart registers as neutral despite the price surge, because the 200-day EMA at 2.44 remains above the shorter averages.
- Hourly RSI at 81.15 and price above the upper Bollinger band signal an overbought momentum condition, not a structural trend reversal.
- A daily close below 2.66 would mark the breakout as a spike; losing 2.87 would confirm failure.
- Broader market conditions offer no confirmation for this isolated rally, with flat aggregate cap and concentrated liquidity.
What the daily chart reveals about the setup
The daily chart shows a price that has jumped over its moving averages rather than one supported by a healed structural trend. Price at 3.27 sits above the 20-day EMA at 2.02, the 50-day at 1.72, and the 200-day at 2.44. However, the EMAs themselves remain ordered like a downtrend: the 200 above the 20, and the 20 above the 50. The trend has not turned — the price has simply leapt over it. Until the faster averages climb through 2.44 and hold, this remains a breakout in search of confirmation.
Article Intelligence
Key Entities
UniswapFluid
Sponsored
Ad
NewsLayerLearn more
NewsLayer Premium
Unlock deeper intelligence.
Ad-free reading, exclusive research, and real-time onchain insights.
Go Premium