We use cookies to personalise content and ads, to provide social media features and to analyse our traffic. We also share information about your use of our site with our social media, advertising and analytics partners who may combine it with other information that you’ve provided to them or that they’ve collected from your use of their services.
Necessary cookies help make a website usable by enabling basic functions like page navigation and access to secure areas of the website. The website cannot function properly without these cookies.
_cfuvidThis cookie is a part of the services provided by Cloudflare - Including load-balancing, deliverance of website content and serving DNS connection for website operators.
Maximum Storage Duration: SessionType: HTTP Cookie
__cf_bm [x7]This cookie is used to distinguish between humans and bots. This is beneficial for the website, in order to make valid reports on the use of their website.
CookieConsentStores the user's cookie consent state for the current domain
Maximum Storage Duration: 1 yearType: HTTP Cookie
Preference cookies enable a website to remember information that changes the way the website behaves or looks, like your preferred language or the region that you are in.
We do not use cookies of this type.
Statistic cookies help website owners to understand how visitors interact with websites by collecting and reporting information anonymously.
We do not use cookies of this type.
Marketing cookies are used to track visitors across websites. The intention is to display ads that are relevant and engaging for the individual user and thereby more valuable for publishers and third party advertisers.
We do not use cookies of this type.
Unclassified cookies are cookies that we are in the process of classifying, together with the providers of individual cookies.
List of domains your consent applies to: [#BULK_CONSENT_DOMAINS#]
Cookie declaration last updated on 8/12/26 by Cookiebot
[#IABV2_TITLE#]
[#IABV2_BODY_INTRO#]
[#IABV2_BODY_LEGITIMATE_INTEREST_INTRO#]
[#IABV2_BODY_PREFERENCE_INTRO#]
[#IABV2_BODY_PURPOSES_INTRO#]
[#IABV2_BODY_PURPOSES#]
[#IABV2_BODY_FEATURES_INTRO#]
[#IABV2_BODY_FEATURES#]
[#IABV2_BODY_PARTNERS_INTRO#]
[#IABV2_BODY_PARTNERS#]
About
Cookies are small text files that can be used by websites to make a user's experience more efficient.
The law states that we can store cookies on your device if they are strictly necessary for the operation of this site. For all other types of cookies we need your permission.
This site uses different types of cookies. Some cookies are placed by third party services that appear on our pages.
You can at any time change or withdraw your consent from the Cookie Declaration on our website.
Learn more about who we are, how you can contact us and how we process personal data in our Privacy Policy.
Please state your consent ID and date when you contact us regarding your consent.
Install NewsLayer
Get the app experience — one tap from your home screen, instant loads and breaking-news alerts.
Shiba Inu (SHIB), Bitcoin (BTC), Near Protocol (NEAR) and Hyperliquid (HYPE) Price Analysis for August 16: Foundation for Market Recovery
After its most recent recovery failed to result in a long-term trend reversal, Shiba Inu is making an effort to stabilize. Although SHIB is currently trading at $0.000453, up about 1.6 percent on the daily candle, sellers are still…
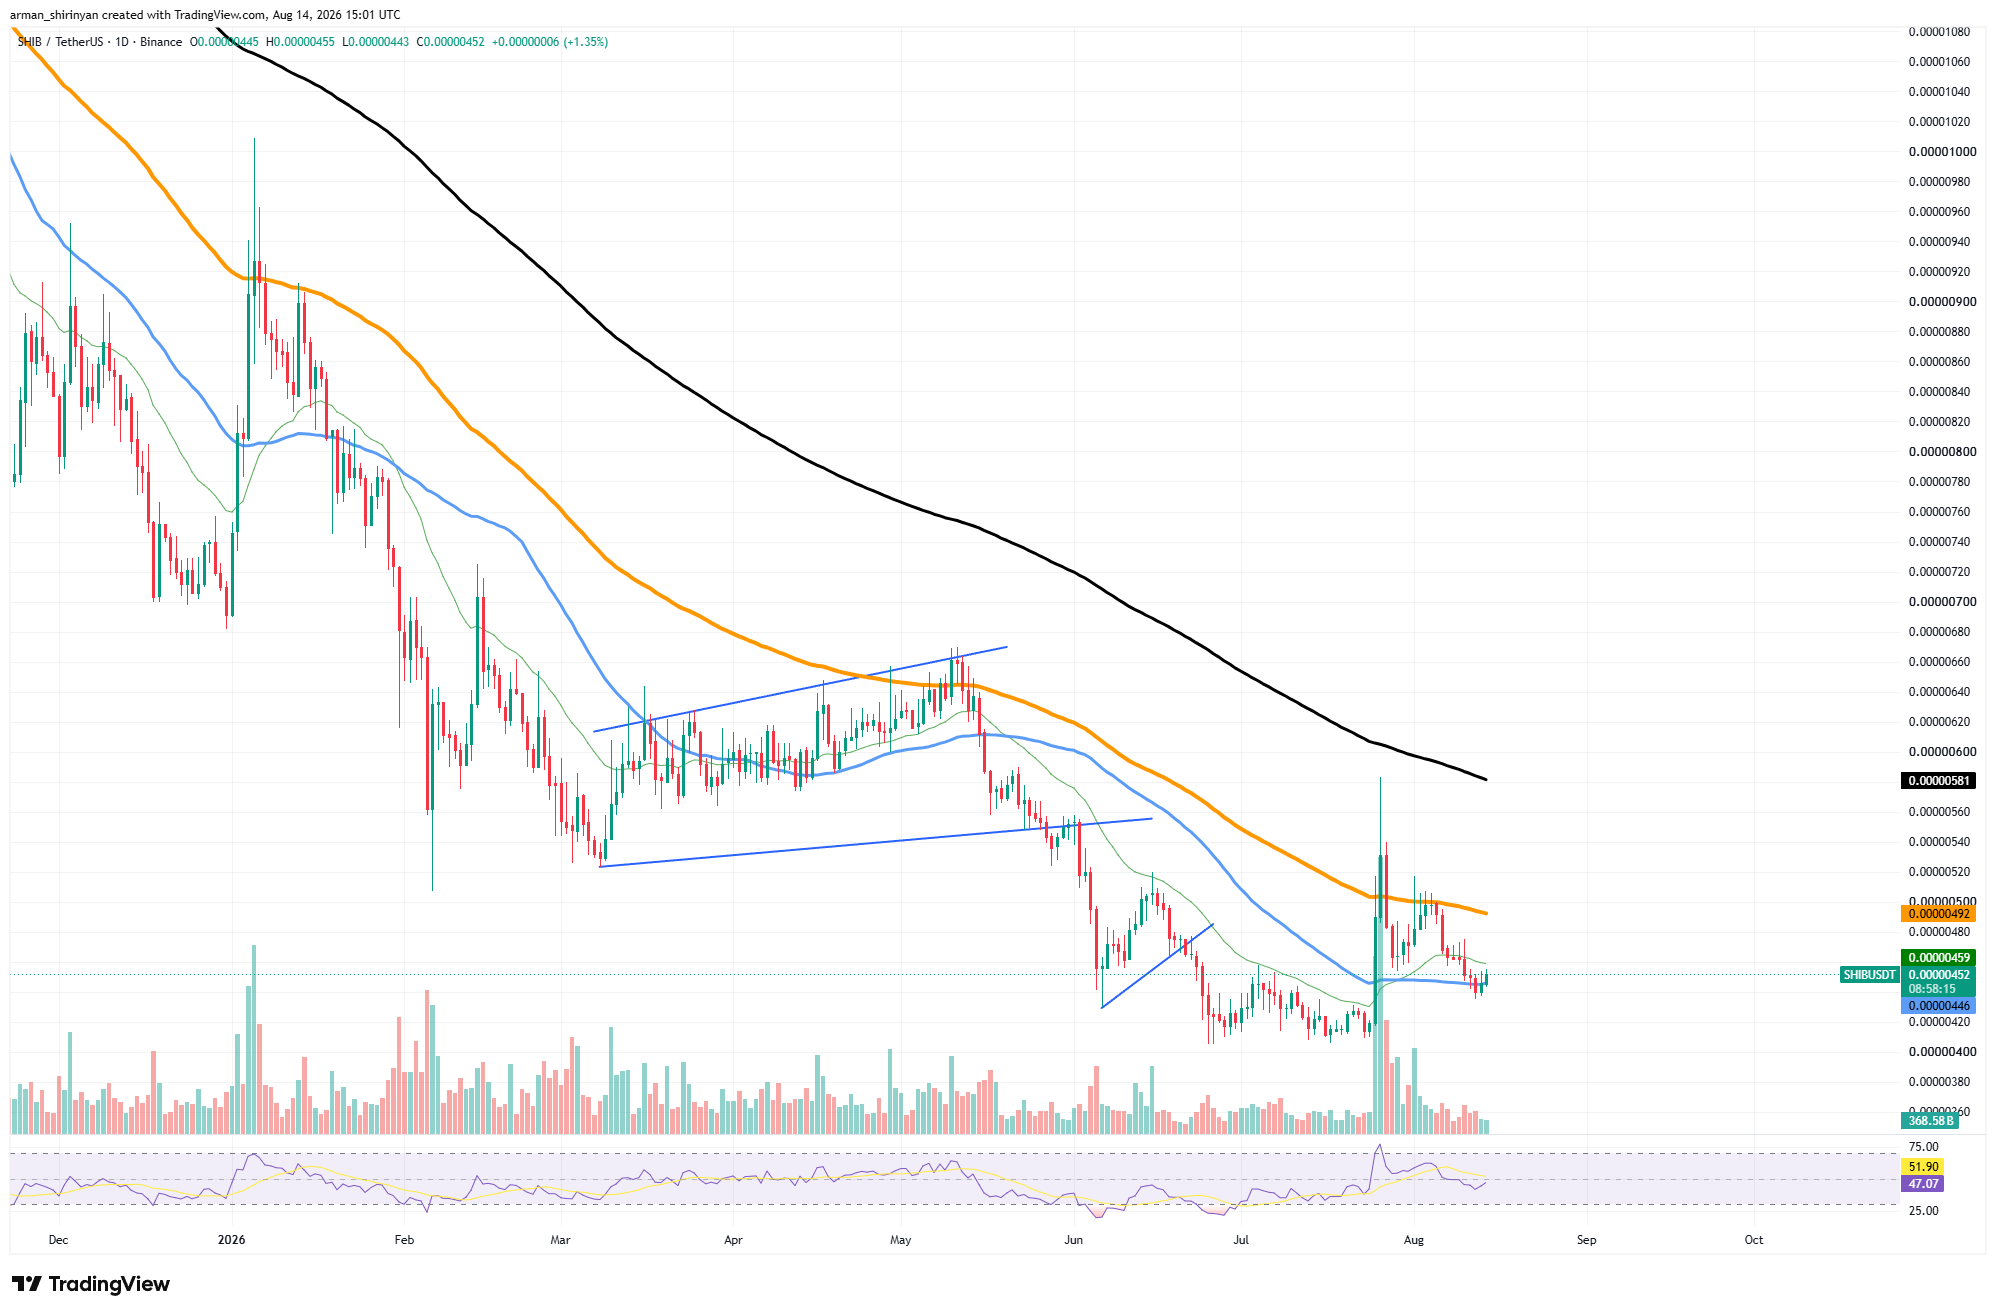
After its most recent recovery failed to result in a long-term trend reversal, Shiba Inu is making an effort to stabilize. Although SHIB is currently trading at $0.000453, up about 1.6 percent on the daily candle, sellers are still favored by the larger technical structure. The short-term moving averages of SHIB are the most recent developments.
The price is testing around $0.00000446 and is currently sitting just below the short-term average near $0.000459. As a result, a small consolidation zone is formed around current levels. The first sign that buyers are regaining short-term control would be the recovery of $0.00000459.
SHIB/USDT Chart by TradingView
Nonetheless, $0.00000492 represents much stronger resistance. After the dramatic late-July volatility spike, this moving average rejected SHIB and is still the most significant nearby barrier. The path toward roughly $0.00000520–$0.00000550 could be opened by a daily close above it.
The long-term outlook is still significantly weaker. At $0.00000581, SHIB is trading well below the 200-day moving average, which is still declining. Rallies should still be viewed as attempts at recovery within a broader bearish structure until the price begins closing above these longer-term trend indicators.
The immediate support area on the downside is represented by $0.00000440–$0.00000445. If it were lost, attention would return to the July consolidation around $0.00000420.
SHIB might be subject to another test of the recent lows if it breaks below that area. Momentum offers a slightly more positive signal. Recovering from lower levels without going into overbought territory, the RSI is currently at about 47.5. As a result, buyers have the opportunity to push higher if demand recovers.
Bitcoin's decline accelerates
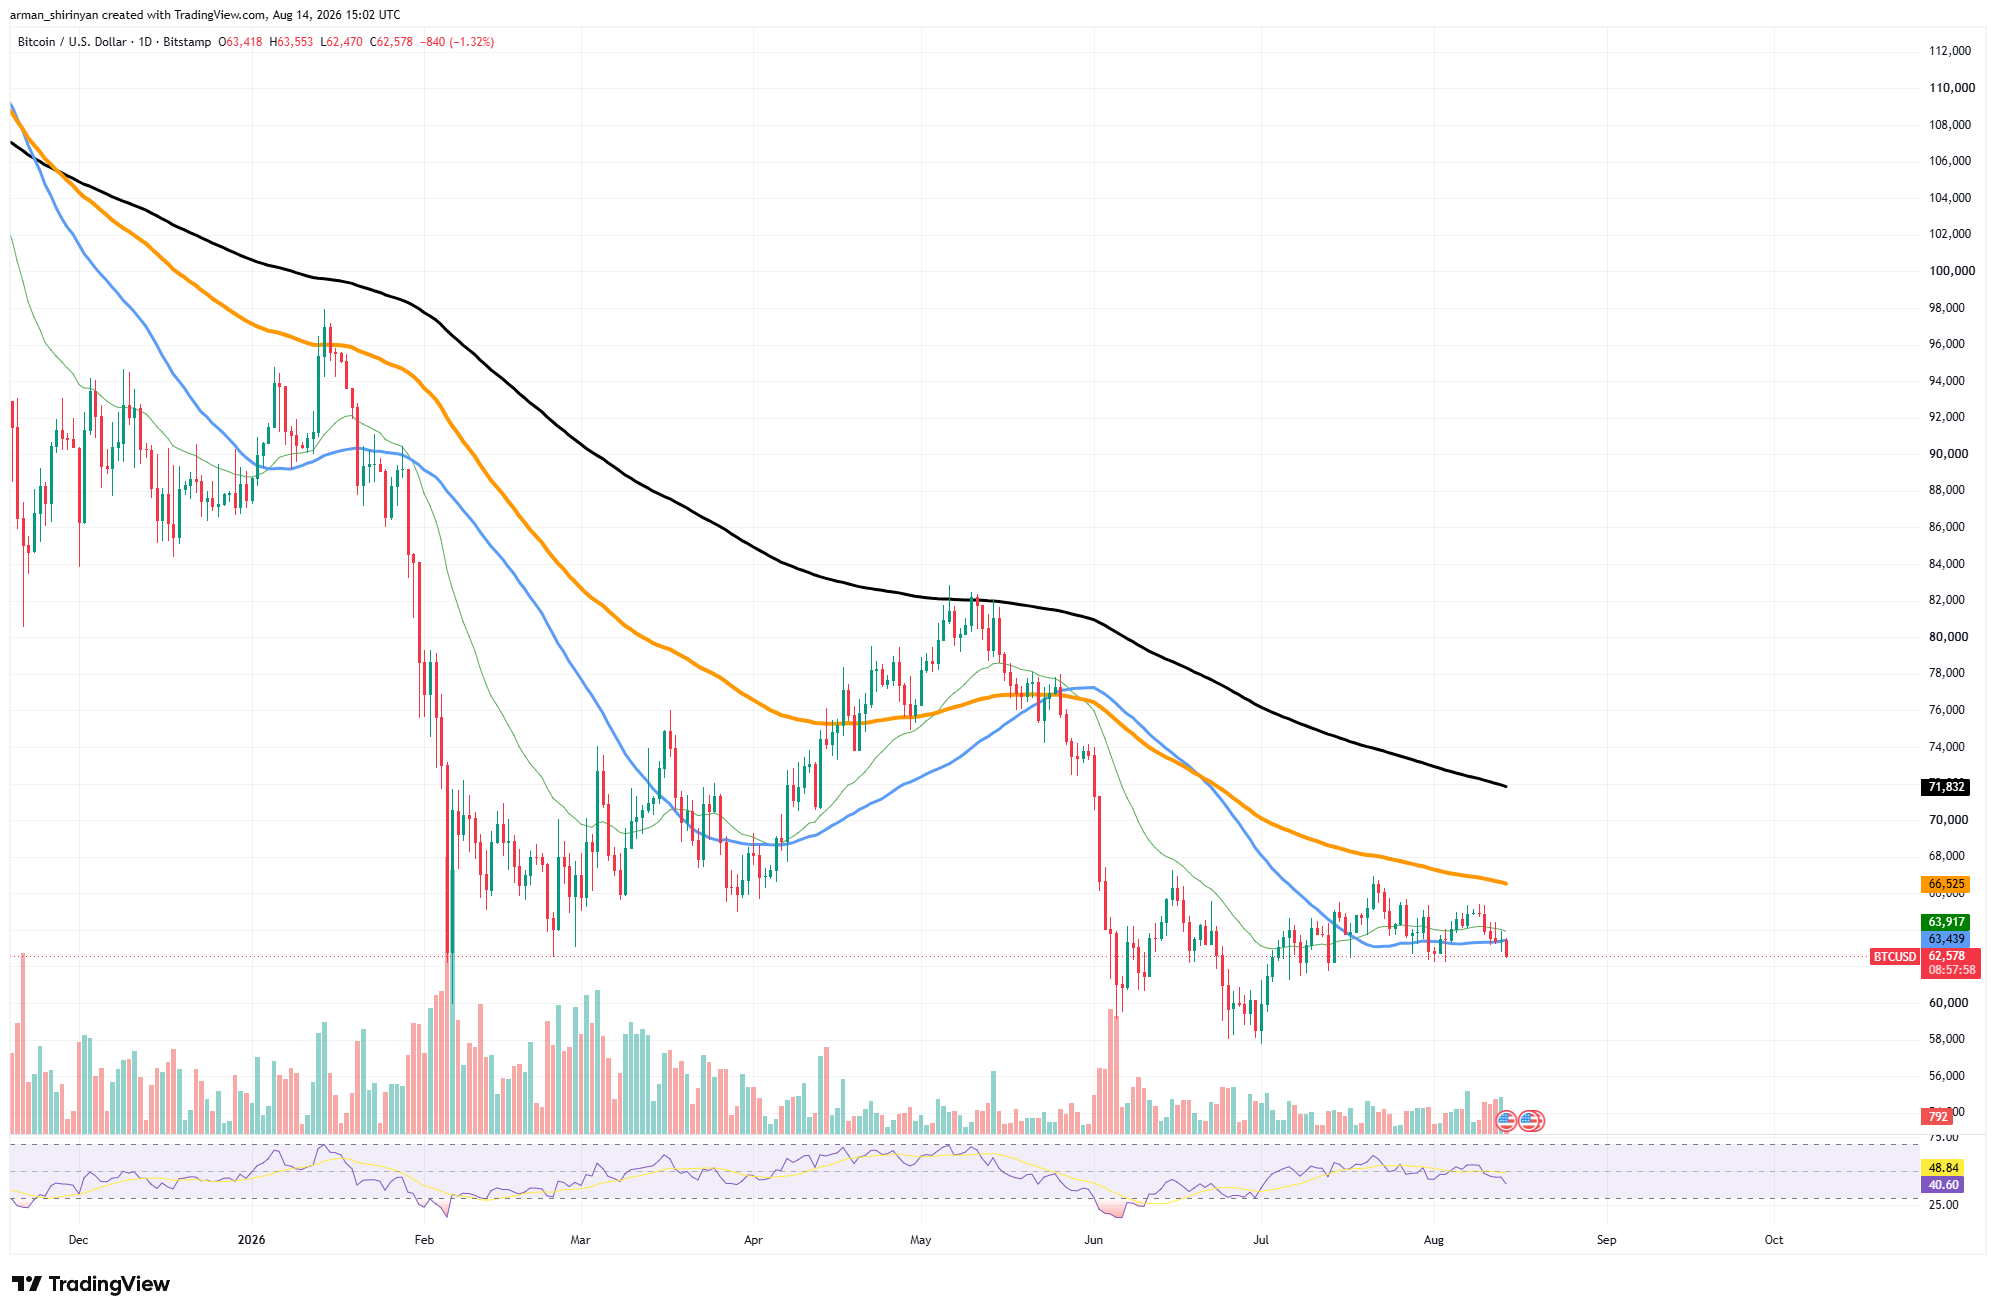
Although Bitcoin is still stuck in a small consolidation range, the most recent rejection raises the possibility that the structure will resolve downward. After a daily decline of about 1.2 percent, which caused the price to drop below its short-term moving averages, Bitcoin is currently trading at about $62,587.
The cluster between $63,400 and $63,900 is the current technical issue. Over the past few weeks, Bitcoin has fluctuated in this region several times, but buyers have not been able to turn it into dependable support.
BTC/USDT Chart by TradingView
Sellers are once again in control of the immediate structure after the most recent move below both short-term averages. That cautious reading is supported by momentum. The RSI has dropped to 40.65, but the signal line is still at 48.8. As a result, although Bitcoin is losing ground, it is still not in an oversold position.
This allows for one more decline before technical fatigue becomes a serious issue. The next significant range is between $61,500 and $62,000. Since July, selling pressure has been absorbed by this zone multiple times.
The current consolidation would be significantly weakened by a decisive daily close below it, revealing the $60,000 psychological threshold. The late-June low between $58,000 and $59,000 becomes the main downside reference below $60,000. The upside is still severely constrained.
Before challenging the more significant resistance around $66,500, where the intermediate moving average is currently located, Bitcoin must first recover from $63,900 to $64,000. Since Bitcoin has continuously traded below this declining trend indicator, recovering $66,500 would be a far more significant change. Longer-term resistance is still much higher at $71,800, indicating the amount of technical work that Bitcoin still needs to do before the overall chart turns bullish once more.
Near Protocol struggles for now
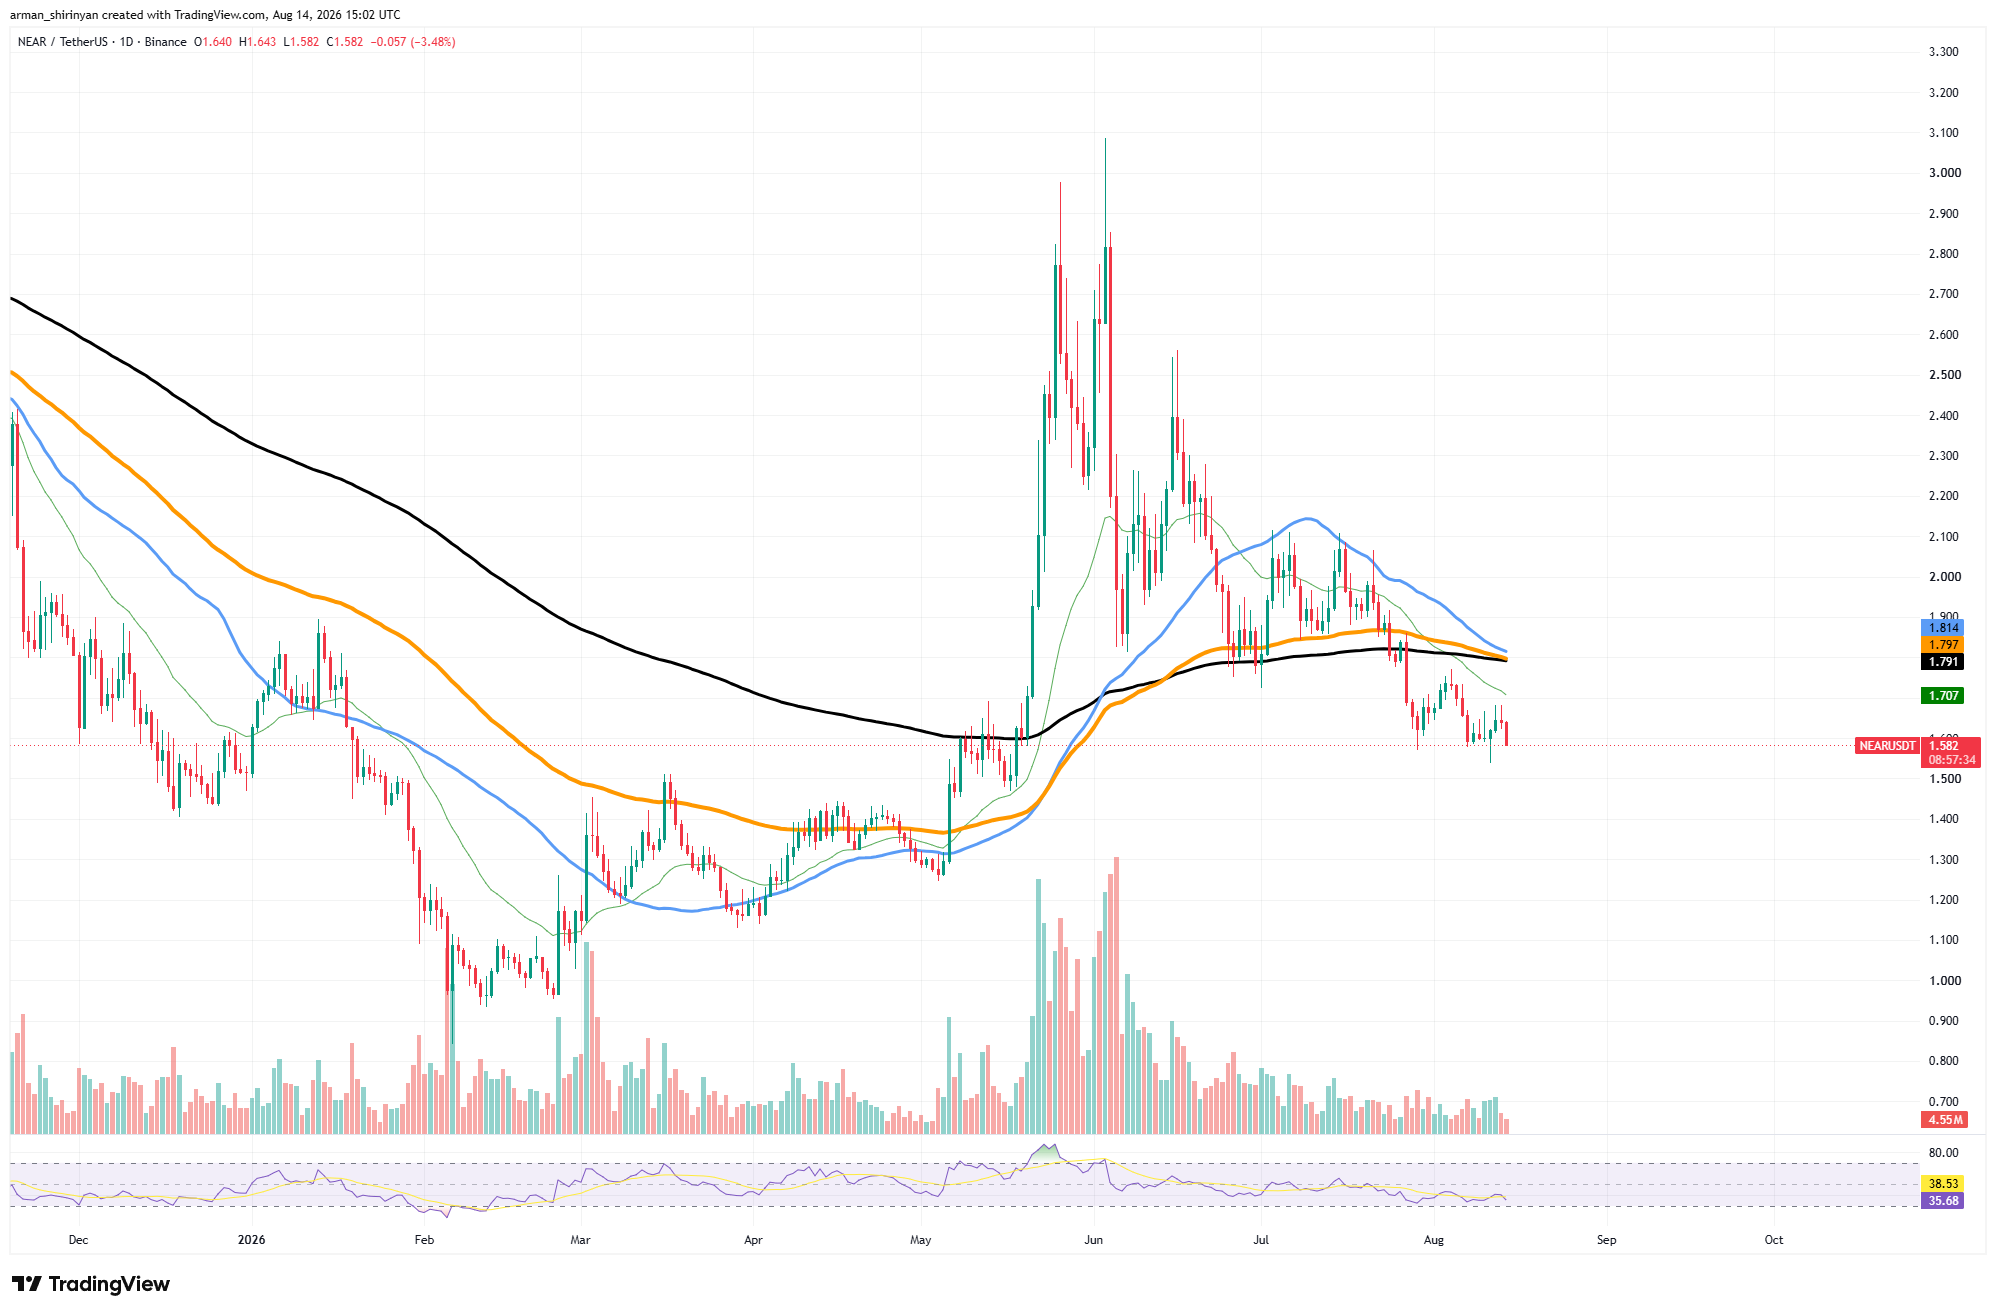
As buyers struggle to create a compelling recovery structure, Near Protocol continues to face significant technical pressure. Despite sporadic attempts to stabilize around recent lows, NEAR continues to trade below its major moving averages, making the overall trend bearish. Regaining the short-term moving-average cluster is the current challenge.
The fact that NEAR has consistently failed to turn these dynamic resistance levels into support indicates that sellers are still taking advantage of comparatively small rebounds to lower exposure. Upside moves are still susceptible to rejection unless that changes. In this situation, momentum is also crucial.
NEAR/USDT Chart by TradingView
Although the RSI has recovered from its lowest readings during earlier sell-offs, it has not yet demonstrated the kind of consistent movement above the neutral 50 level that would point to a significant shift in favor of buyers. As a result, NEAR is in a potentially stabilizing but technically vulnerable position.
A series of higher daily lows followed by a break above the closest short-term resistance would be the first positive signal. After that, NEAR would have to prove that the recovery goes beyond a brief relief bounce by challenging the intermediate moving average. Recent local lows continue to be a crucial benchmark on the downside.
The emerging stabilization would be invalidated and the current pattern of lower highs and lower lows would be reinforced by another breakdown below that zone. As a result, NEAR is still in the recovery-attempt stage rather than a proven reversal.
Before the overall technical picture can significantly improve, buyers must recover short-term resistance and hold onto it as support.
Hyperliquid looks recovery-ready
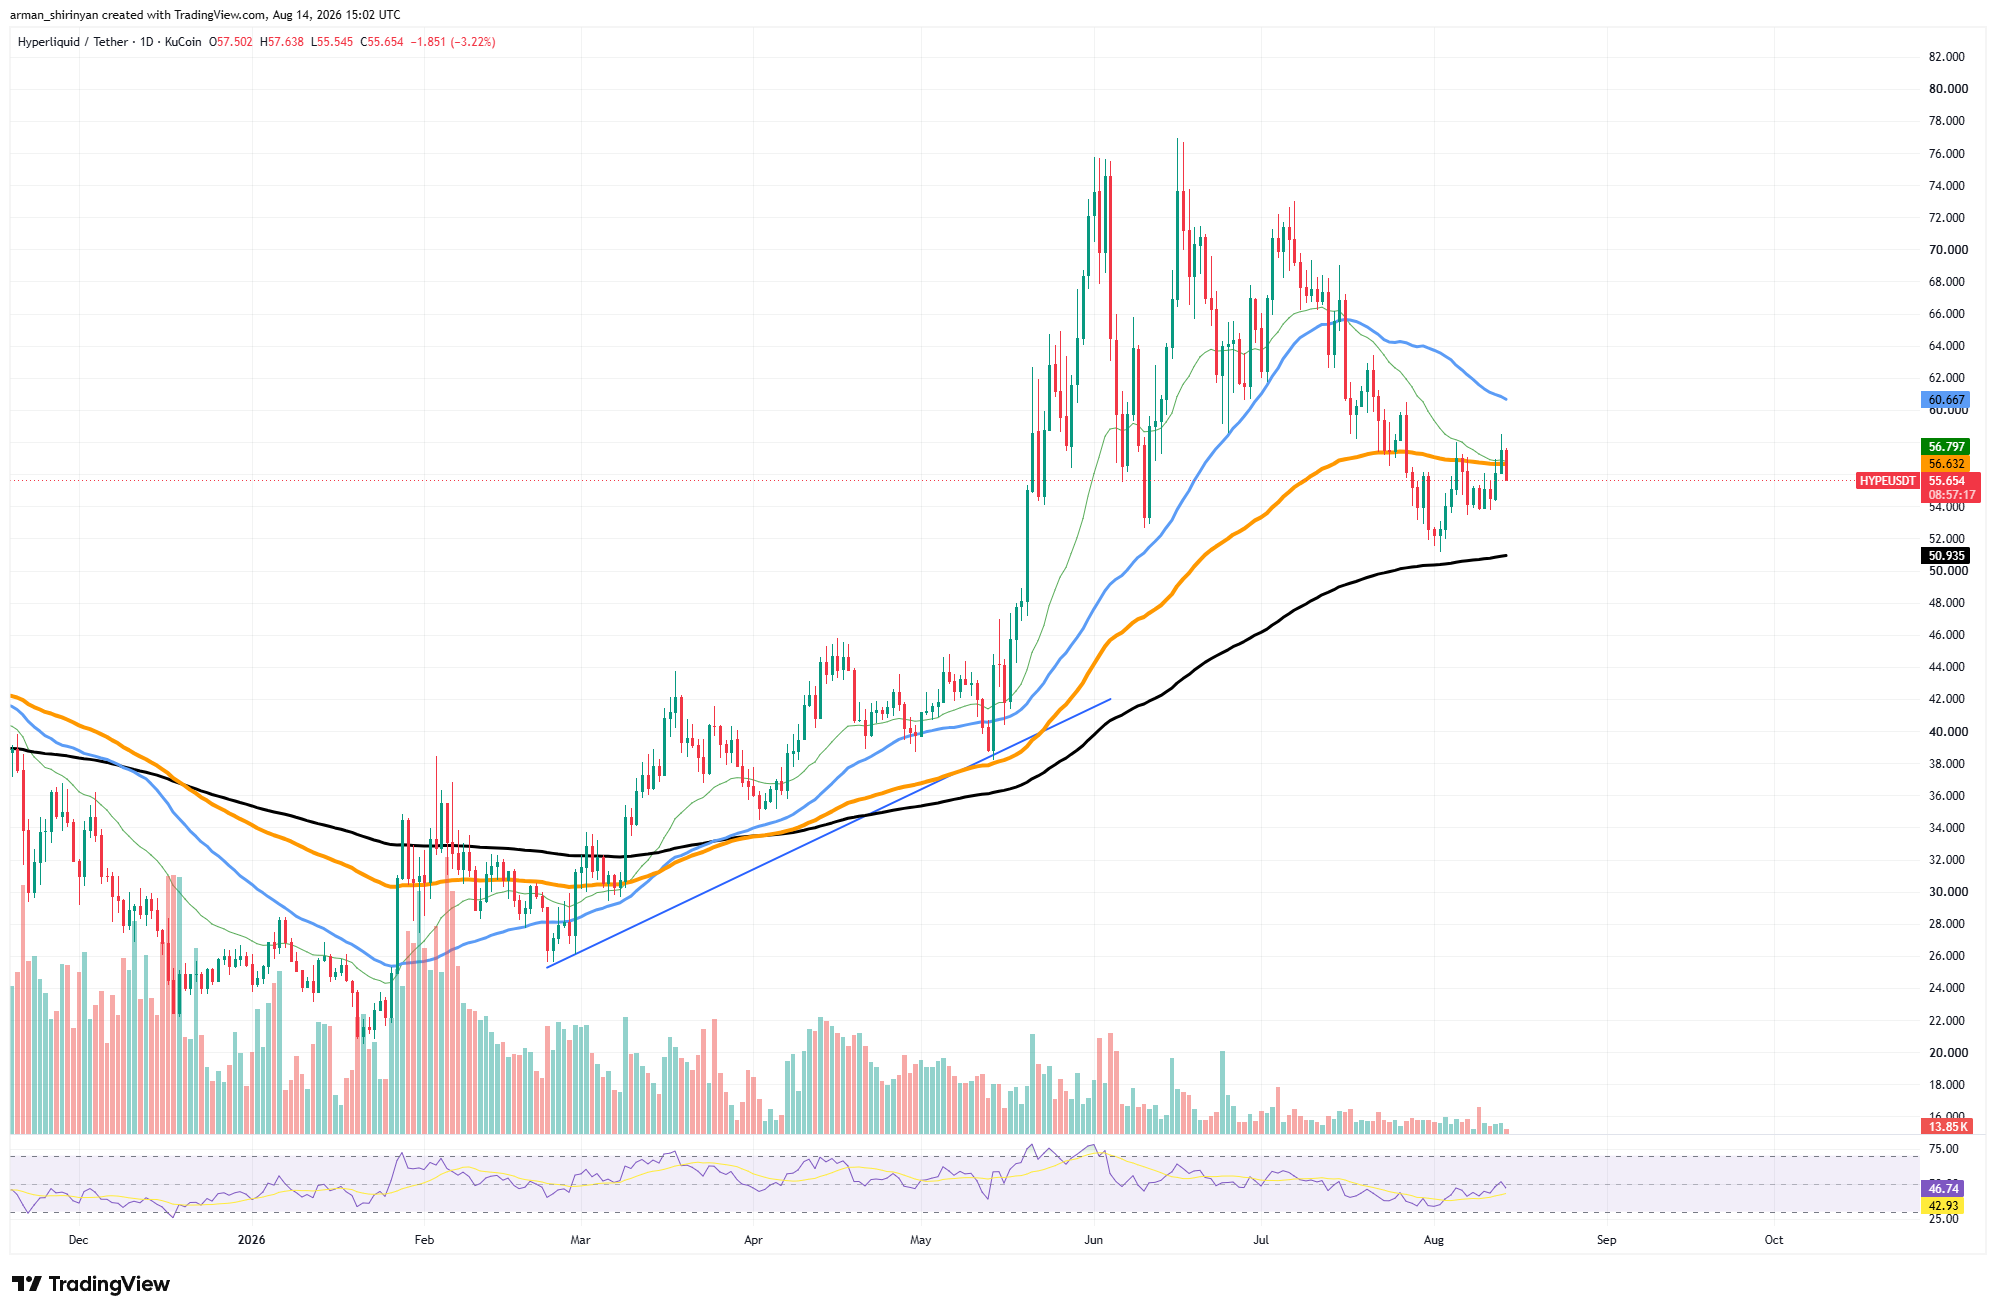
Although Hyperliquid's recovery still faces a significant resistance test, it is in a far stronger technical position. HYPE is trying to establish itself around $56-$57, where the intermediate moving average currently creates a significant decision point, after recovering from the $51-$52 range.
HYPE/USDT Chart by TradingView
The rebound is significant because the long-term moving average, which was around $50.90, held during the recent correction. After dropping precipitously from the $70+ area, HYPE came close to that level but managed to avoid a more serious breakdown.
The larger structure maintains a plausible bullish foundation as long as the $50–$52 region endures. Now, a consistent move above roughly $56.50–$57 is the immediate goal. A daily close above this area could enhance short-term momentum and pave the way for the next significant resistance around $60–$61, as HYPE has frequently interacted with this region.
Because the declining medium-term moving average is located close to $60.70, that level is especially significant. Reclaiming it would offer far more convincing proof that the correction from July's highs has ended.
Though it's still unclear, momentum is increasing. After spending a large portion of the recent correction below the neutral 50 region, the RSI has recovered in that direction. This indicates a decrease in selling pressure, but buyers have not yet demonstrated a definite advantage in momentum.
Another retest of $53–$54 is possible if HYPE fails at $56–$57. A loss of $50.90 would be far more detrimental and could turn the current correction into a more severe bearish structure. As of right now, HYPE has defended the level it had to defend; the question is whether buyers will be able to convert that defense into a real breakout.