

NewsLayer

Install NewsLayer

Get the app experience — one tap from your home screen, instant loads and breaking-news alerts.

NewsLayer.com
LatestDaily BriefMarkets
NewsLayer PulseLIVE₿BTC$84,600+0.61%ΞETH$2,690+0.57%◎SOL$117.53+2.48%✕XRP$1.54+3.71%ÐDOGE$0.0961+3.77%₳ADA$0.2504+5.88%Total Cap$3.01T+0.47%24H Vol$167.5BLayer Index44 Neutral
BreakingAsia dominates Crypto Adoption Index, Bitget’s $351M hack: Asia Express2 saat önce
Markets
HomeMarketsCrypto

Markets|Crypto

The Complete Guide to Crypto Market Data: Prices, Charts, Exchanges and Momentum

The single number displayed next to an asset is more constructed than it appears, and understanding how it is constructed explains why it sometimes behaves strangely.

TechBullion

Publisher

Sep 19, 2026 at 5:11 AM UTC · 13 dk okuma
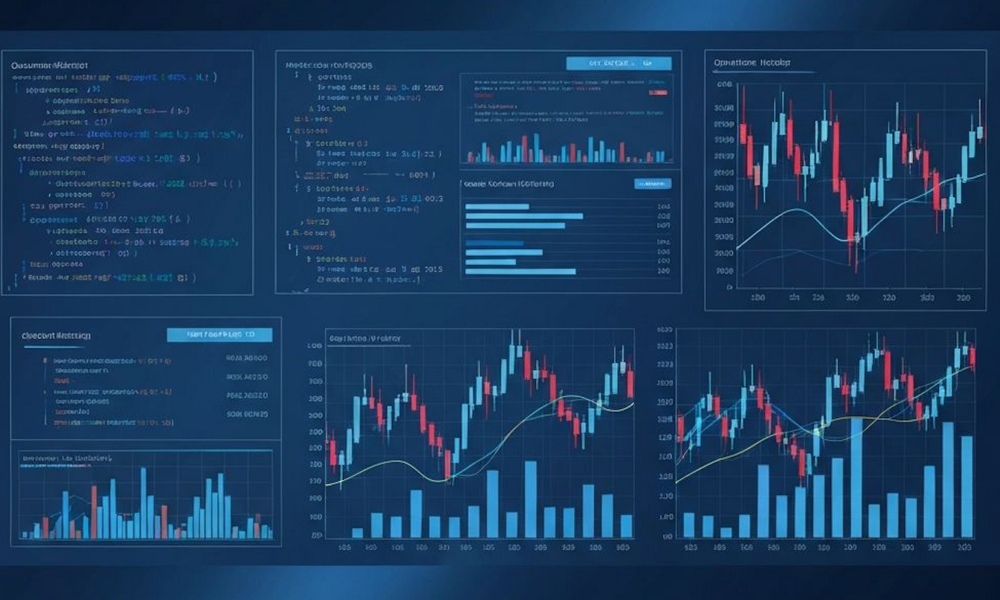
The Complete Guide to Crypto Market Data: Prices, Charts, Exchanges and Momentum
Image via TechBullion

Market Impact

Total MCap+0.47%

Last Updated

6 gün önce

Çevriliyor…

Part One: What a Price Actually Is

The single number displayed next to an asset is more constructed than it appears, and understanding how it is constructed explains why it sometimes behaves strangely.

Last trade, mid price, and the spread between them

There are at least three defensible answers to “what is the price right now”:

  • Last traded price — the most recent executed transaction. This is what most displays show. It is historical by definition, and on an illiquid asset it may be minutes or hours old.
  • Best bid — the highest price anyone is currently willing to buy at.
  • Best ask — the lowest price anyone is currently willing to sell at.

The gap between best bid and best ask is the spread, and it is the first cost you pay on any trade. On a major pair the spread might be one or two basis points. On a thin mid-cap pair it can exceed 100 basis points — meaning you lose over 1% the instant you enter and exit, before any exchange fee applies.

When you check crypto prices today live chart data, the figure displayed is typically the last trade or a volume-weighted aggregate across venues. Both are accurate as records. Neither guarantees you can transact there.

Why prices differ across exchanges

Market Context

Total Market Cap$3.01T+0.47%
24H Volume$167.5B
BTC Dominance56.3%

Updated 9 dakika önce

View All Markets

Article Intelligence

Topics

marketscrypto

Sponsored

Ad
House — Advertise on NewsLayer
NewsLayerLearn more

NewsLayer Premium

Unlock deeper intelligence.

Ad-free reading, exclusive research, and real-time onchain insights.

Go Premium
NewsLayer.com

The front page of the onchain economy. Crypto, Web3 and regulation intelligence — live prices, original research and policy tracking in one layer.

Follow on XTelegram

News

  • Latest News
  • The Daily Brief
  • Crypto
  • DeFi
  • Policy
  • Web3
  • Blockchain
  • Explainers

Markets

  • Market News
  • Layer Index
  • Live Charts
  • DeFi Protocols
  • Regulation Tracker
  • Regulation Radar

Company

  • About NewsLayer
  • Advertise
  • PR Publication
  • Become an Author
  • Our Authors
  • Create Account
  • Sign in

Resources

  • Research
  • NewsLayer Originals
  • My Feed
  • Search
  • AI Sector
  • Quantum Sector

NewsLayer Premium

Read the full layer.

Unlock premium intelligence, original research and an ad-free reading experience.

  • Premium Intelligence briefings
  • Ad-free reading experience
  • Members-only research & data
Go Premium

© 2026 NewsLayer.com — The front page of the onchain economy

Privacy Policy·Terms of Service
NewsLayer

Get the signal, not the noise.

Markets, regulation and onchain intelligence in a 5-minute morning read — plus breaking alerts and Layer Index flips as they happen.

The Daily Brief

Breaking alerts

Index flips

Free · No spam · Unsubscribe anytime
