Key Highlights
Bitcoin Upside Push Stalls Again at a Key Barrier
Bitcoin price made another attempt to settle above $65,500 against the US Dollar but failed. BTC started a fresh decline, but losses were limited.
Action Forex
Publisher
Aug 12, 2026 at 2:51 AM UTC · 1 phút đọc

Key Signal
$65,409 Bitcoin recent high
Entities
bitcoin
Market Impact
BTC+0.39%$83,350
Last Updated
2 tháng trước
- Bitcoin faced a few rejections near $65,500.
- There was a move below a bullish trend line with support at $64,850 on the 4-hour chart of BTC/USD.
- Ethereum also struggled above $1,920 and trimmed gains.
- The US Consumer Price Index could increase by 3.4% in July 2026 (YoY).
Bitcoin Price Technical Analysis
Bitcoin price made another attempt to settle above $65,500 against the US Dollar but failed. BTC started a fresh decline, but losses were limited.
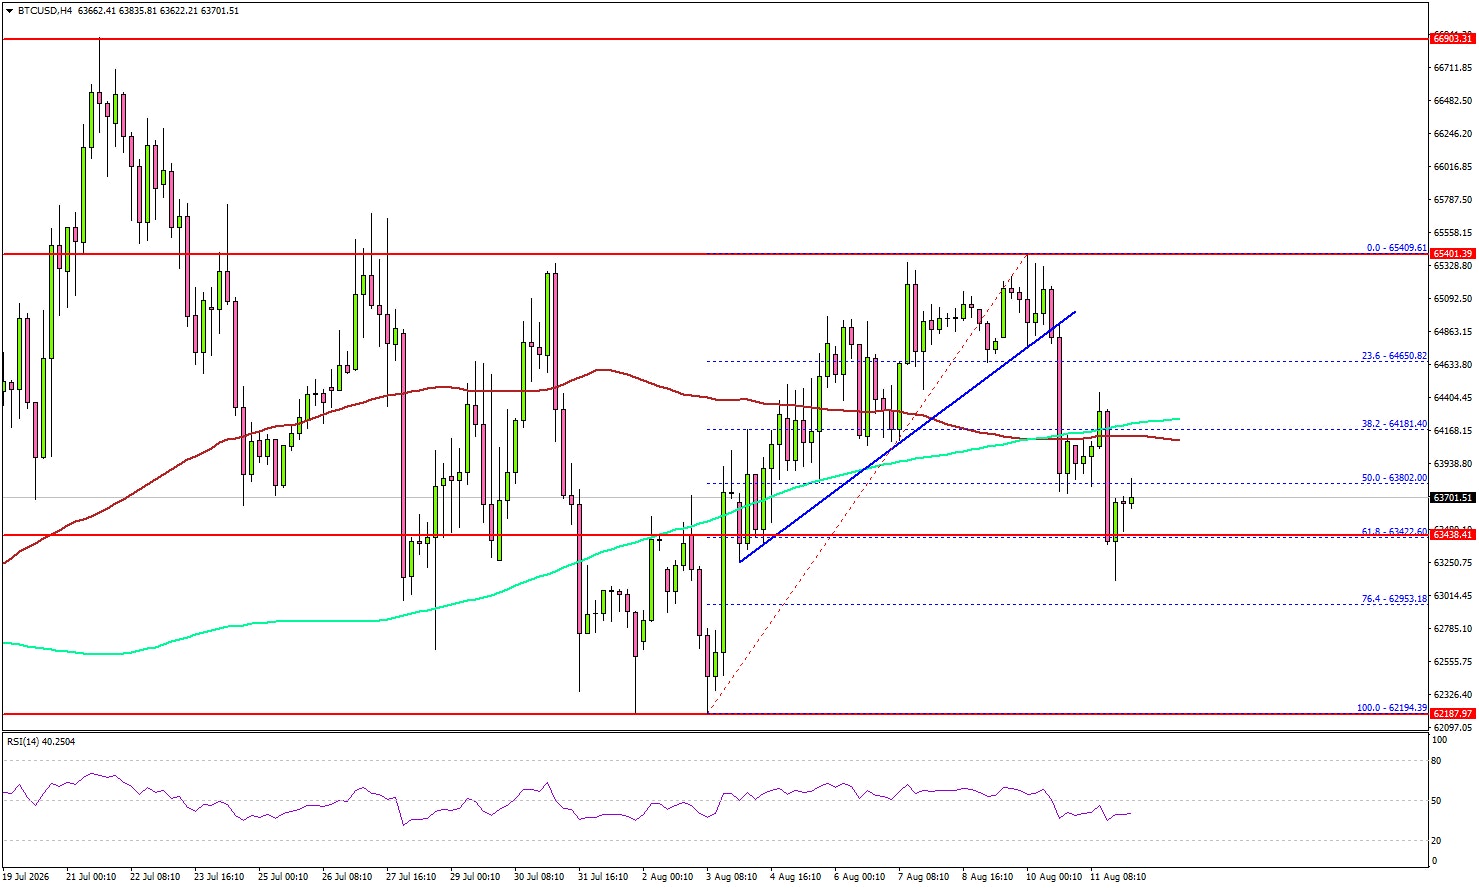
Looking at the 4-hour chart, the price formed a high near $65,409 and started a fresh decline. There was a move below $65,000 and $64,850. The price traded below the 38.2% Fib retracement level of the upward move from the $62,194 swing low to the $65,409 high.
BTC spiked below the 100 simple moving average (red, 4-hour) and the 200 simple moving average (green, 4-hour). If the bears remain in action, the price might find bids near the 61.8% Fib retracement level at $63,420.
Bitcoin moved from $77,305.1 to $83,360.5 over the last 30-day period, a gain of 7.8 percent.
Source: Kraken · NewsLayer Markets · Updated vài giây trước
A downside break and close below $63,420 could trigger a sharp decline. In the stated scenario, the price could test $62,000 or even $61,200.
On the upside, an immediate resistance could be $65,000. The first major resistance might be $65,500. The main resistance might be $66,800. A close above $66,800 could send the price toward $68,800. Any more gain might call for a test of $70,000.
Looking at Ethereum, the price seems to be facing a major hurdle near $1,920 and $1,950. The key support might be $1,820.
Today’s Key Economic Releases
- US Consumer Price Index for July 2026 (MoM) – Forecast +0.1%, versus -0.4% previous.
- US Consumer Price Index for July 2026 (YoY) – Forecast +3.4%, versus +3.5% previous.
- US Consumer Price Index Ex Food & Energy for July 2026 (YoY) – Forecast +2.5%, versus +2.6% previous.
Sourced by
Originally reported by Action Forex
NewsLayer coverage based on externally reported material.
The Daily Brief
The onchain economy, before your day starts.
Curated markets, onchain insights, and key headlines — delivered every weekday morning.
Weekdays · Free · ~5 minute read
0
Applause
Was this article helpful?
Market Context
Bitcoin
BTC
$83,421
+0.47% (24H)
Market Cap
$1.67T
24H Volume
$28.3B
24H High
$85,604
Article Intelligence
Key Entities
Topics
Related Coverage
 CryptoBitcoin Spot Demand Remains Weak as Short-Term Holder Profit-Taking Weighs on Price25 phút trước · 2 min read
 CryptoBitcoin ETFs see $6.34B inflows in Q3 as Bitcoi...35 phút trước · 1 min read
 CryptoBitcoin ETFs draw $6.3B in Q3 as BTC price rises nearly 43%một giờ trước · 1 min read
Sponsored
Ad
NewsLayerLearn more
NewsLayer Premium
Unlock deeper intelligence.
Ad-free reading, exclusive research, and real-time onchain insights.
Go Premium