

NewsLayer

Install NewsLayer

Get the app experience — one tap from your home screen, instant loads and breaking-news alerts.

NewsLayer.com
LatestDaily BriefMarkets
NewsLayer PulseLIVE₿BTC$80,839+4.54%ΞETH$2,500+4.78%◎SOL$103.43+3.30%✕XRP$1.44+5.95%ÐDOGE$0.0869+5.76%₳ADA$0.2215+8.15%Total Cap$2.84T+4.09%24H Vol$304.6BLayer Index70 Greed
BreakingPocket Bitcoin Reports Data Breach Affecting 5,411 Customers, Including KYC Documents2 giờ trước
Markets
HomeCrypto

Crypto

Will Zora crypto break $0.0121 resistance? Watch out for THIS major signal

Zora [ZORA] fell 1.51% in 24 hours, but swing traders and investors have reason to adopt a bullish bias. The $34.2 million altcoin gained 27% over seven days and traded 37% above its month-ago price.

AMBCrypto

Publisher

Sep 3, 2026 at 12:00 PM UTC · 2 phút đọc

Will Zora crypto break $0.0121 resistance? Watch out for THIS major signal
Image via AMBCrypto
Đang dịch…

Zora [ZORA] fell 1.51% in 24 hours, but swing traders and investors have reason to adopt a bullish bias. The $34.2 million altcoin gained 27% over seven days and traded 37% above its month-ago price.

Zora’s Base App integration allows creators to monetize their posts. However, Trading Volume dropped 46% over 24 hours as ZORA retraced approximately 36% within three days.

Did the decline signal fading demand, or was the market retesting Zora’s breakout?

The 160% August rally has shifted Zora crypto trends
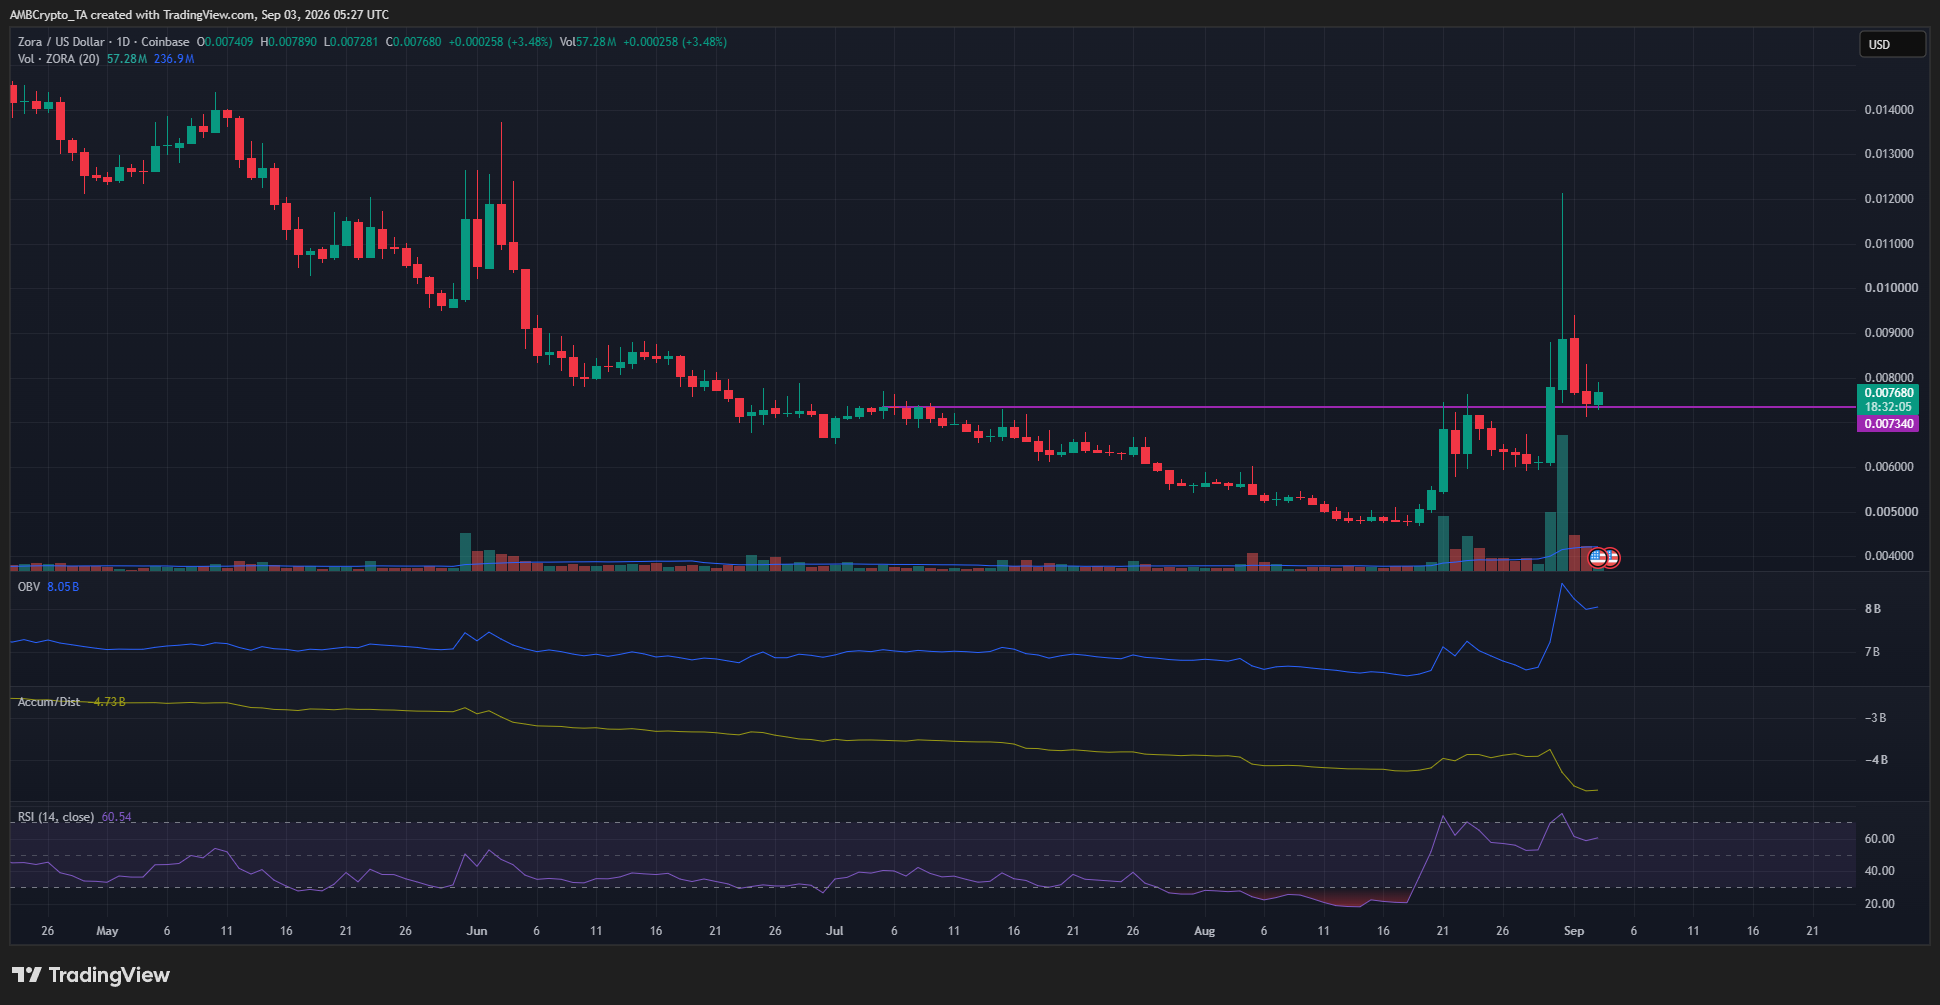
Source: ZORA/USD on TradingView

For a year now, Zora crypto has operated within a bearish trend on the 1-day timeframe. Since June, the token has been sliding lower with very few sizeable price bounces, till the one in August.

Using the 1-day timeframe, a lower high (purple) at $0.007 was identified as the latest swing high that kept the bear trend alive.

Reach crypto's most engaged readers — advertise mid-article on NewsLayer
Sponsored

Reach crypto's most engaged readers — advertise mid-article on NewsLayer

NewsLayer

Ad

The latest rally took prices to $0.0121, well past the previous swing high. This move marked a bullish structure shift.

Interestingly, the OBV made new highs and was trending higher while the A/D indicator fell lower. This was a result of how the indicators are calculated and not a divergence. The large upward wick was what caused the A/D indicator’s decline.

Traders’ call to action: Buy

Article Intelligence

Topics

crypto

Sponsored

Ad
House — Advertise on NewsLayer
NewsLayerLearn more

NewsLayer Premium

Unlock deeper intelligence.

Ad-free reading, exclusive research, and real-time onchain insights.

Go Premium
NewsLayer.com

The front page of the onchain economy. Crypto, Web3 and regulation intelligence — live prices, original research and policy tracking in one layer.

Follow on XTelegram

News

  • Latest News
  • The Daily Brief
  • Crypto
  • DeFi
  • Policy
  • Web3
  • Blockchain
  • Explainers

Markets

  • Market News
  • Layer Index
  • Live Charts
  • DeFi Protocols
  • Regulation Tracker
  • Regulation Radar

Company

  • About NewsLayer
  • Advertise
  • PR Publication
  • Become an Author
  • Our Authors
  • Create Account
  • Sign in

Resources

  • Research
  • NewsLayer Originals
  • My Feed
  • Search
  • AI Sector
  • Quantum Sector

NewsLayer Premium

Read the full layer.

Unlock premium intelligence, original research and an ad-free reading experience.

  • Premium Intelligence briefings
  • Ad-free reading experience
  • Members-only research & data
Go Premium

© 2026 NewsLayer.com — The front page of the onchain economy

Privacy Policy·Terms of Service
NewsLayer

Get the signal, not the noise.

Markets, regulation and onchain intelligence in a 5-minute morning read — plus breaking alerts and Layer Index flips as they happen.

The Daily Brief

Breaking alerts

Index flips

Free · No spam · Unsubscribe anytime
