
Bitcoin price today is facing a potential short-term pullback after its recent rally pushed the market into overbought conditions. The price is currently moving sideways, while traders watch the $76,400–$76,800 area for a possible liquidity sweep.
Bitcoin, Ethereum and XRP Price Prediction: Where Prices Could Move Next
Bitcoin price today is facing a potential short-term pullback after its recent rally pushed the market into overbought conditions. The price is currently moving sideways, while traders watch the $76,400–$76,800 area for a possible…
CryptoRank
Publisher
Aug 31, 2026 at 9:14 AM UTC · 2 分钟阅读
Entities
bitcoin, ethereum, xrp
Market Impact
Total MCap+0.19%
Last Updated
40 分钟前
翻译中…
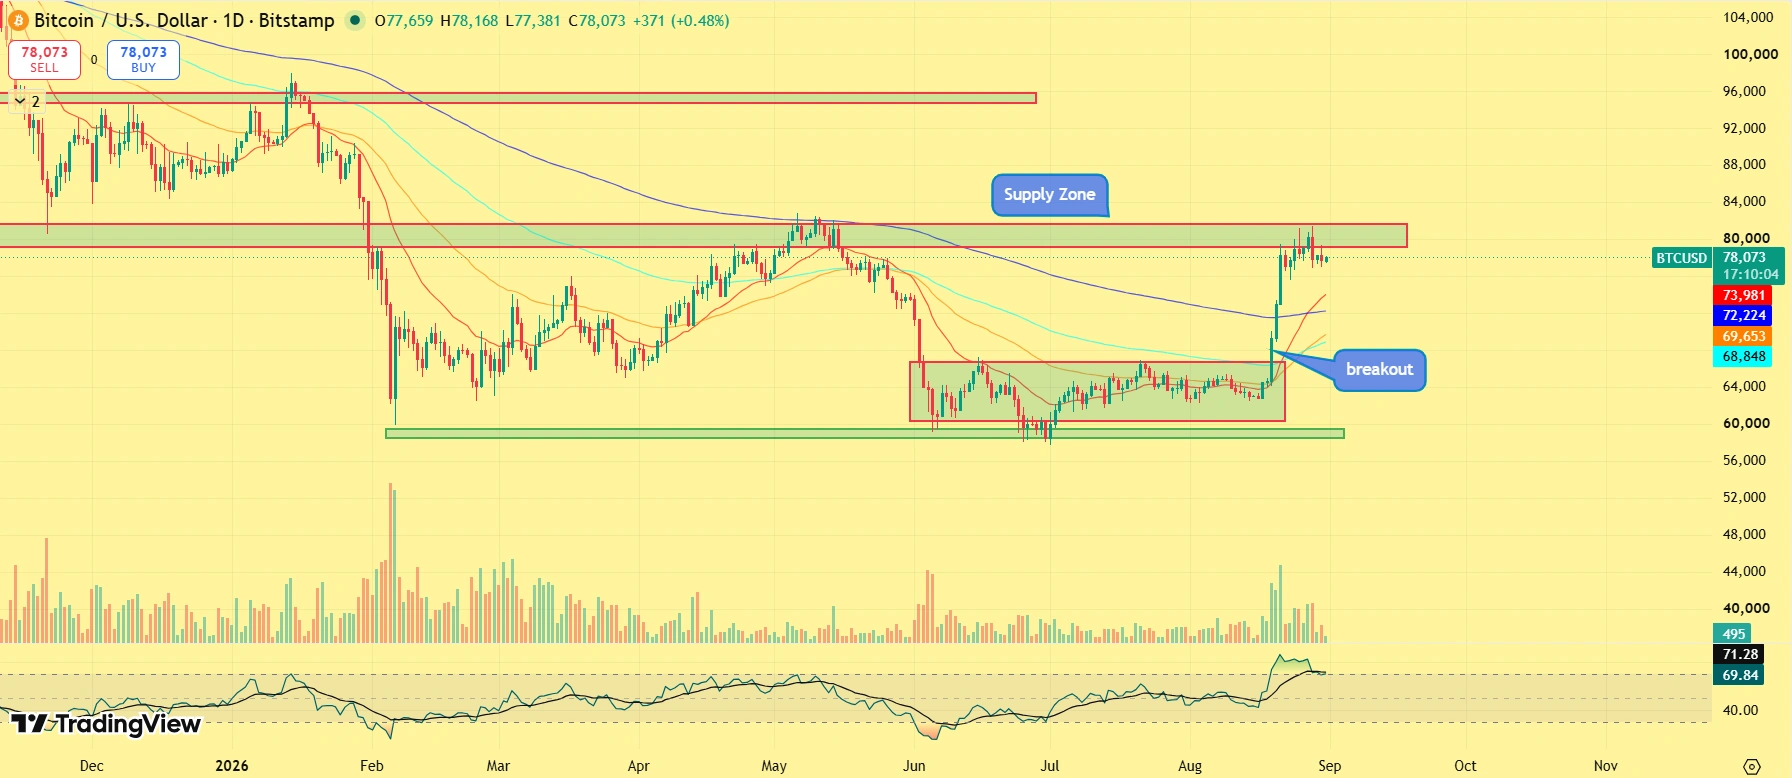
Bitcoin’s weekly Super Trend indicator remains red. The latest weekly candle closed below the roughly $80,000 level needed to flip the indicator back to green and confirm a broader bullish signal.
On the three-day chart, BTC price continues to face resistance between $80,000 and $82,000. Support remains around $73,000–$75,000.
The recent slowdown follows a sharp bullish move that pushed Bitcoin into overbought territory on the daily Relative Strength Index (RSI). The current consolidation is allowing the RSI to reset and could create more room for another move higher if the broader bullish structure remains intact.
Bitcoin Could Test $76,600 Liquidity
Bitcoin recently attempted to reach downside liquidity on the liquidation heat map but fell short. The key liquidity zone is currently concentrated around $76,400–$76,800, with approximately $76,600 emerging as the level to watch.
A move toward this area would represent a short-term pullback rather than a major trend reversal. Bitcoin could also continue trading sideways as bullish momentum cools.
Market Context
Bitcoin
BTC
$78,400
+0.33% (24H)
Market Cap
$1.58T
24H Volume
$23.3B
24H High
$79,372
Article Intelligence
Related Coverage
 CryptoArthur Hayes Says Ethereum May Regain Spotlight as It Strengthens Against Bitcoin28 分钟前 · 1 min read
 CryptoRipple Lawyer Says CLARITY Act Could Boost U.S. Jobs as Crucial Senate Vote Nears2 小时前 · 2 min read
 CryptoTom Lee Says Ethereum Could Reach $6,000 if Bitcoin Hits $150,0002 小时前 · 1 min read
Sponsored
Ad
NewsLayerLearn more
NewsLayer Premium
Unlock deeper intelligence.
Ad-free reading, exclusive research, and real-time onchain insights.
Go Premium