
As of August 13, 2026, Ether.fi crypto trades around $0.40, pinned to its daily pivot while hourly momentum turns tentatively bullish. The daily chart remains neutral, and a Fear & Greed reading of 29 keeps conviction low. The market is waiting for a trigger rather than a direction.
Key takeaways
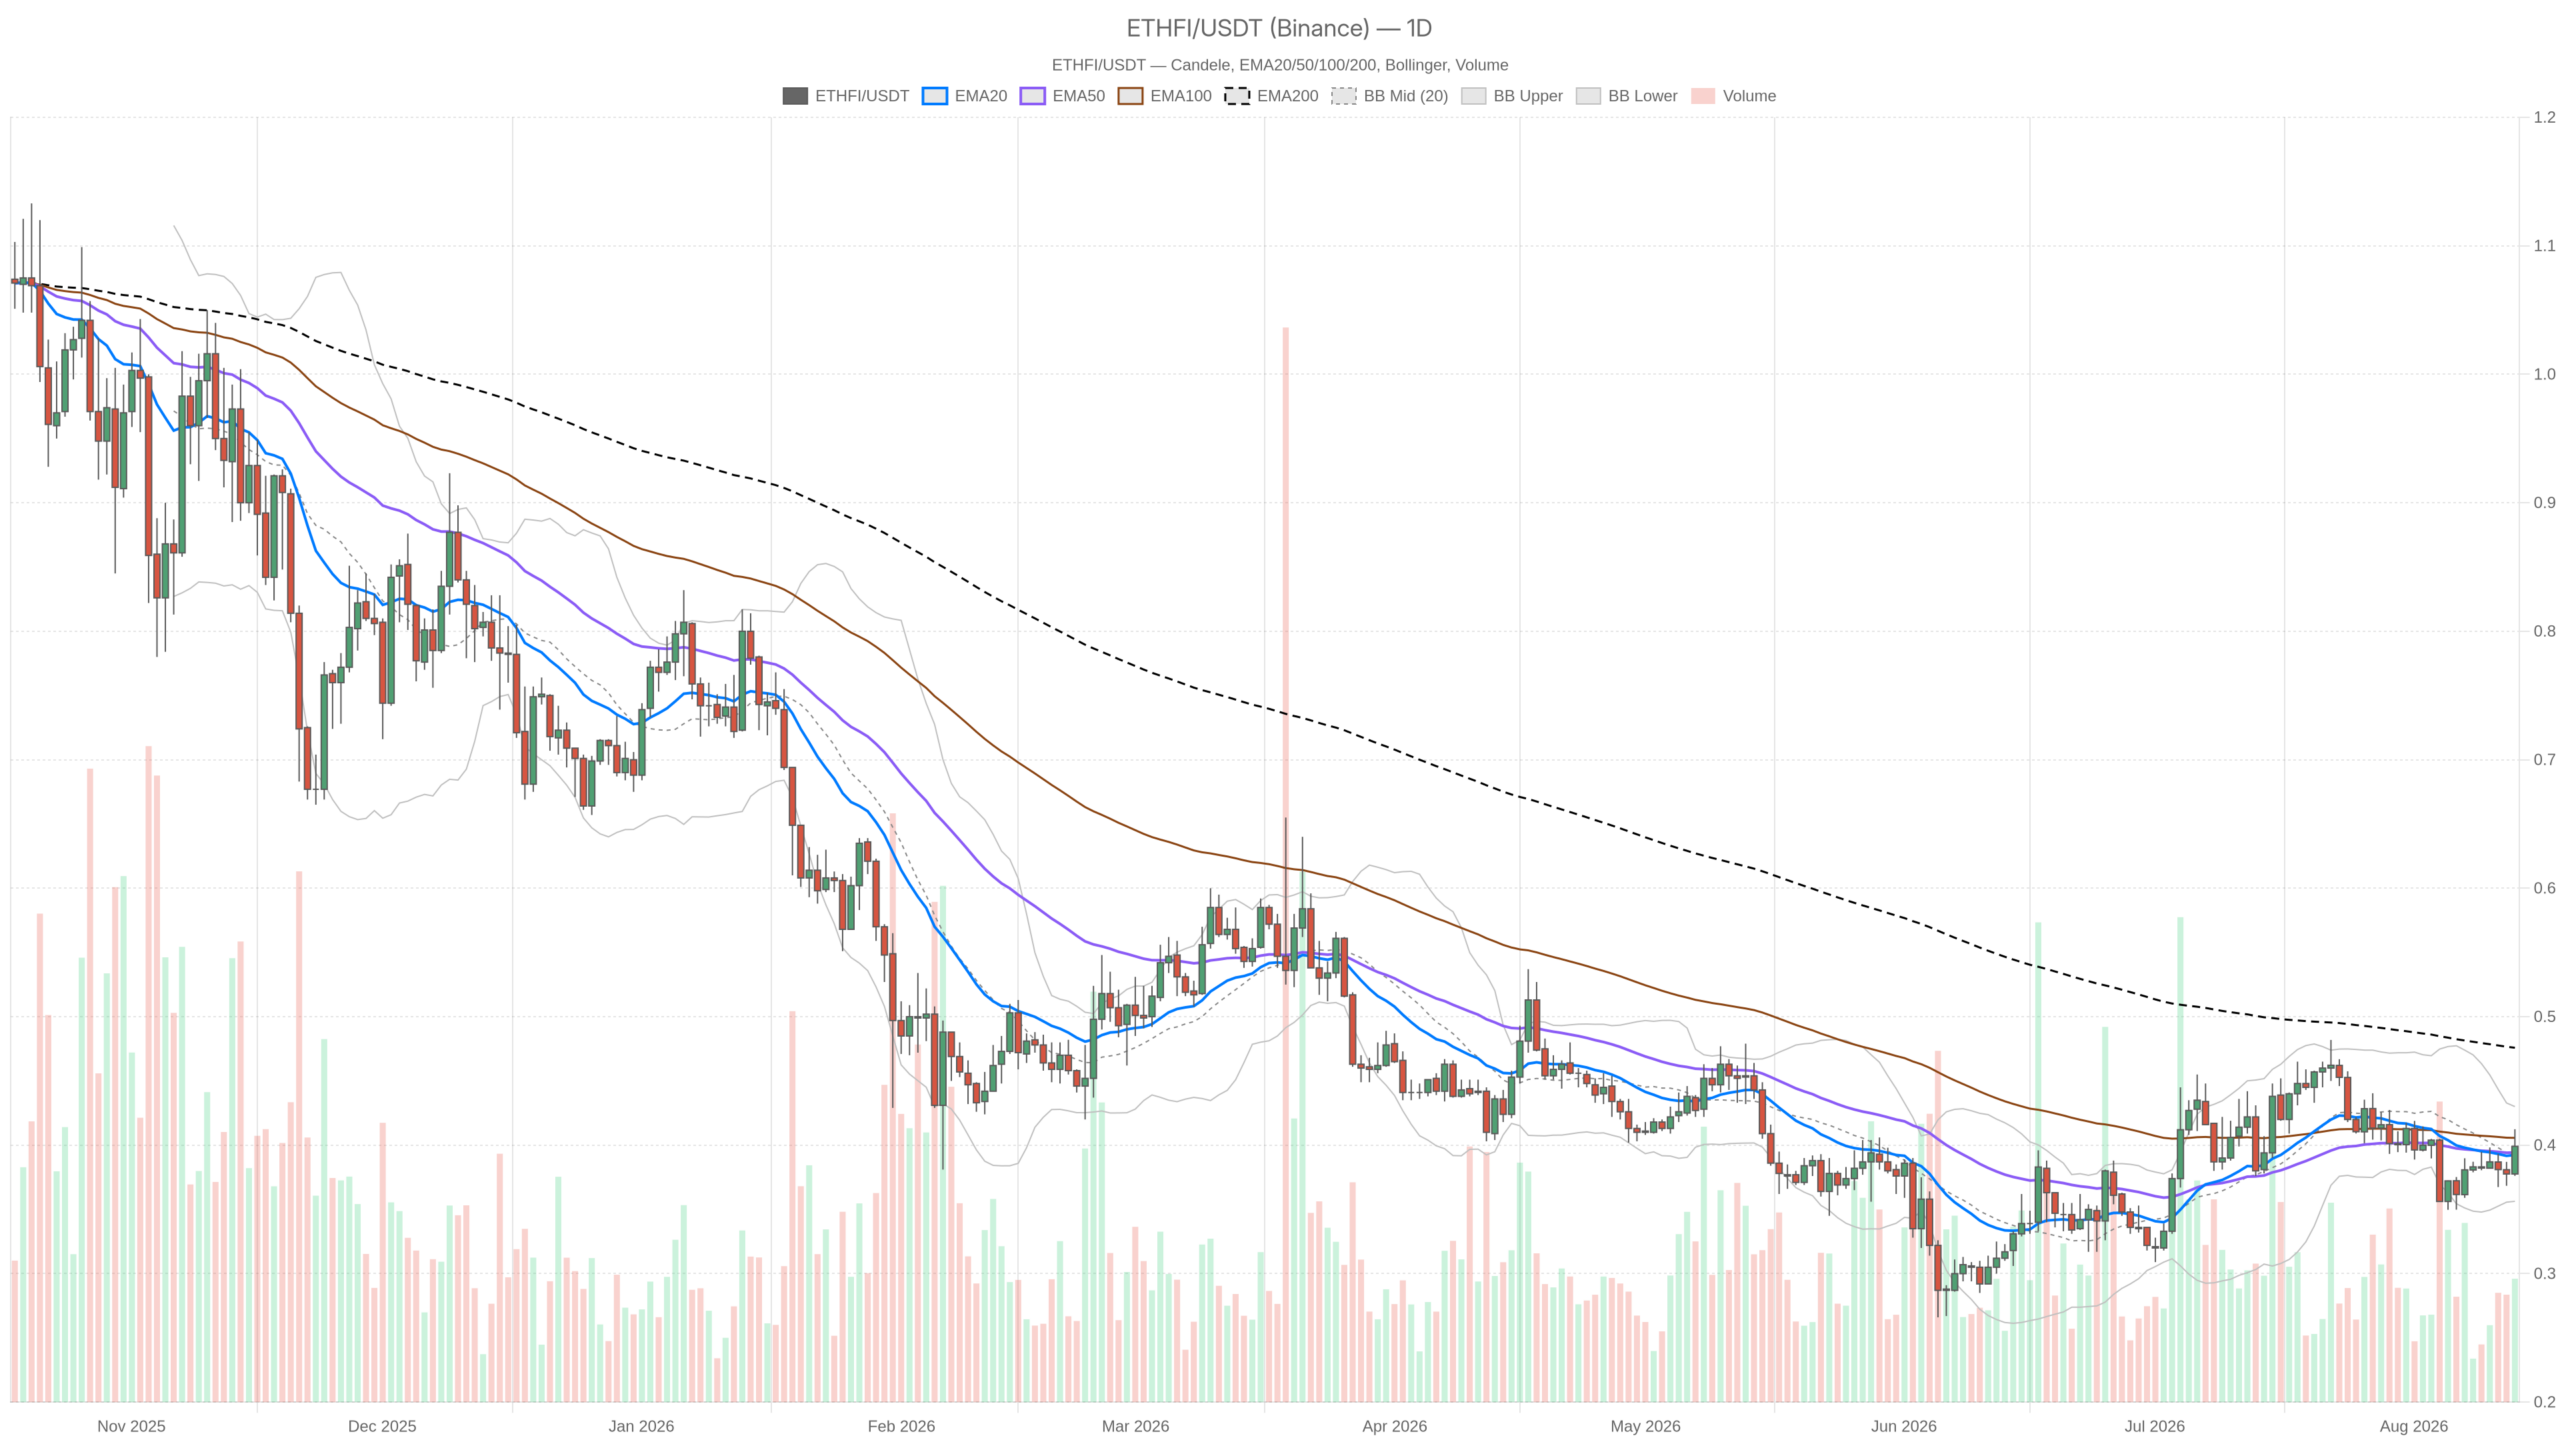
- The token trades near $0.40, essentially on its daily pivot, with the daily EMA200 still above at $0.48.
- Daily indicators are neutral: RSI14 sits at 51.51 while the MACD histogram flattens near zero.
- Short-term momentum leans bullish, with 1H RSI14 at 65.61 and 15m RSI14 at 68.98.
- The Fear & Greed Index reads 29 (Fear), and Bitcoin dominance sits at 56.31%.
- Key levels: resistance at $0.42 (R1) and $0.43 upper band; support at $0.38 (S1) and $0.36 lower band.
The Setup: Caught Between Macro Caution and Intraday Strength
The setup is indecision layered on a longer downtrend that has not been resolved. Ether.fi crypto trades at $0.40 while the daily EMA200 sits well above at $0.48. That gap keeps the bigger picture corrective. Until that longer-term average is reclaimed, every bounce deserves treatment as a recovery attempt inside a heavier structure rather than a full trend reversal.
Daily Timeframe: The Real Bias
The daily chart is neutral, not directional. Price sits basically glued to the EMA20 and EMA50, both at $0.39, while RSI14 rests at 51.51 — dead center. The MACD line and signal both sit near -0.01 with a histogram flattening to zero. In other words, prior bearish momentum has run out of gas without flipping bullish yet.
Moreover, Bollinger Bands show a mid at $0.39, an upper band at $0.43, and a lower band at $0.36 — a fairly tight, contained range for now. ATR14 at $0.02 implies daily volatility near 5% of price, so moves are not explosive but not dead either. The daily pivot at $0.40, with resistance at $0.42 (R1) and support at $0.38 (S1), frames the near-term battlefield. The system tags this regime as neutral, and that is the fair call.
1H and 15m: Momentum Trying to Build a Base
The shorter timeframes tell a more interesting story: buyers are in control and momentum is heating up. On the 1H chart, RSI14 jumps to 65.61, and the EMA stack — 20 at $0.39, 50 and 200 both at $0.38 — slopes upward and supportive, with price trading above all three. That is a short-term bullish tell.
On the 15-minute chart, RSI14 climbs further to 68.98, brushing against overbought territory, with the regime explicitly flagged as bullish and the same supportive EMA stack underneath. The 15m pivot is compressed — pivot, R1 and S1 all cluster near $0.40. That signals a market coiled tightly at a decision point rather than one with room to breathe in either direction.