

截至 2026 年 8 月 19 日,SOL 的交易价格为 $76.83,几乎就在其每日枢轴点 $76.86 上。Solana 加密货币正处于十字路口,短期动能正在为趋势延续提供依据,而更广泛的日线趋势仍然带着深度回撤的伤痕。这种紧张关系定义了整个格局。
Solana 加密货币分析:动能互现,每日枢轴位持稳
Solana 的每日价格枢轴位目前持稳,而动能信号依然好坏参半。分析指出,短期内市场尚未达成明确的方向性共识。
The Cryptonomist
Publisher
Aug 19, 2026 at 2:19 AM UTC · 7 分钟阅读
Key Signal
$76.83 SOL trading price
Entities
solana
Market Impact
SOL-3.88%$106.08
Last Updated
2 个月前
要点速览
- Solana 正企稳在其每日枢轴位附近。
- 动能指标被描述为互现,而非明确的看涨或看跌。
- 这一态势表明交易者正在观察下一步行动的更明确确认。
核心要点
- Solana 交易价格为 $76.83,几乎就在其每日枢轴点 $76.86 上,表明多个时间框架内市场犹豫不决。
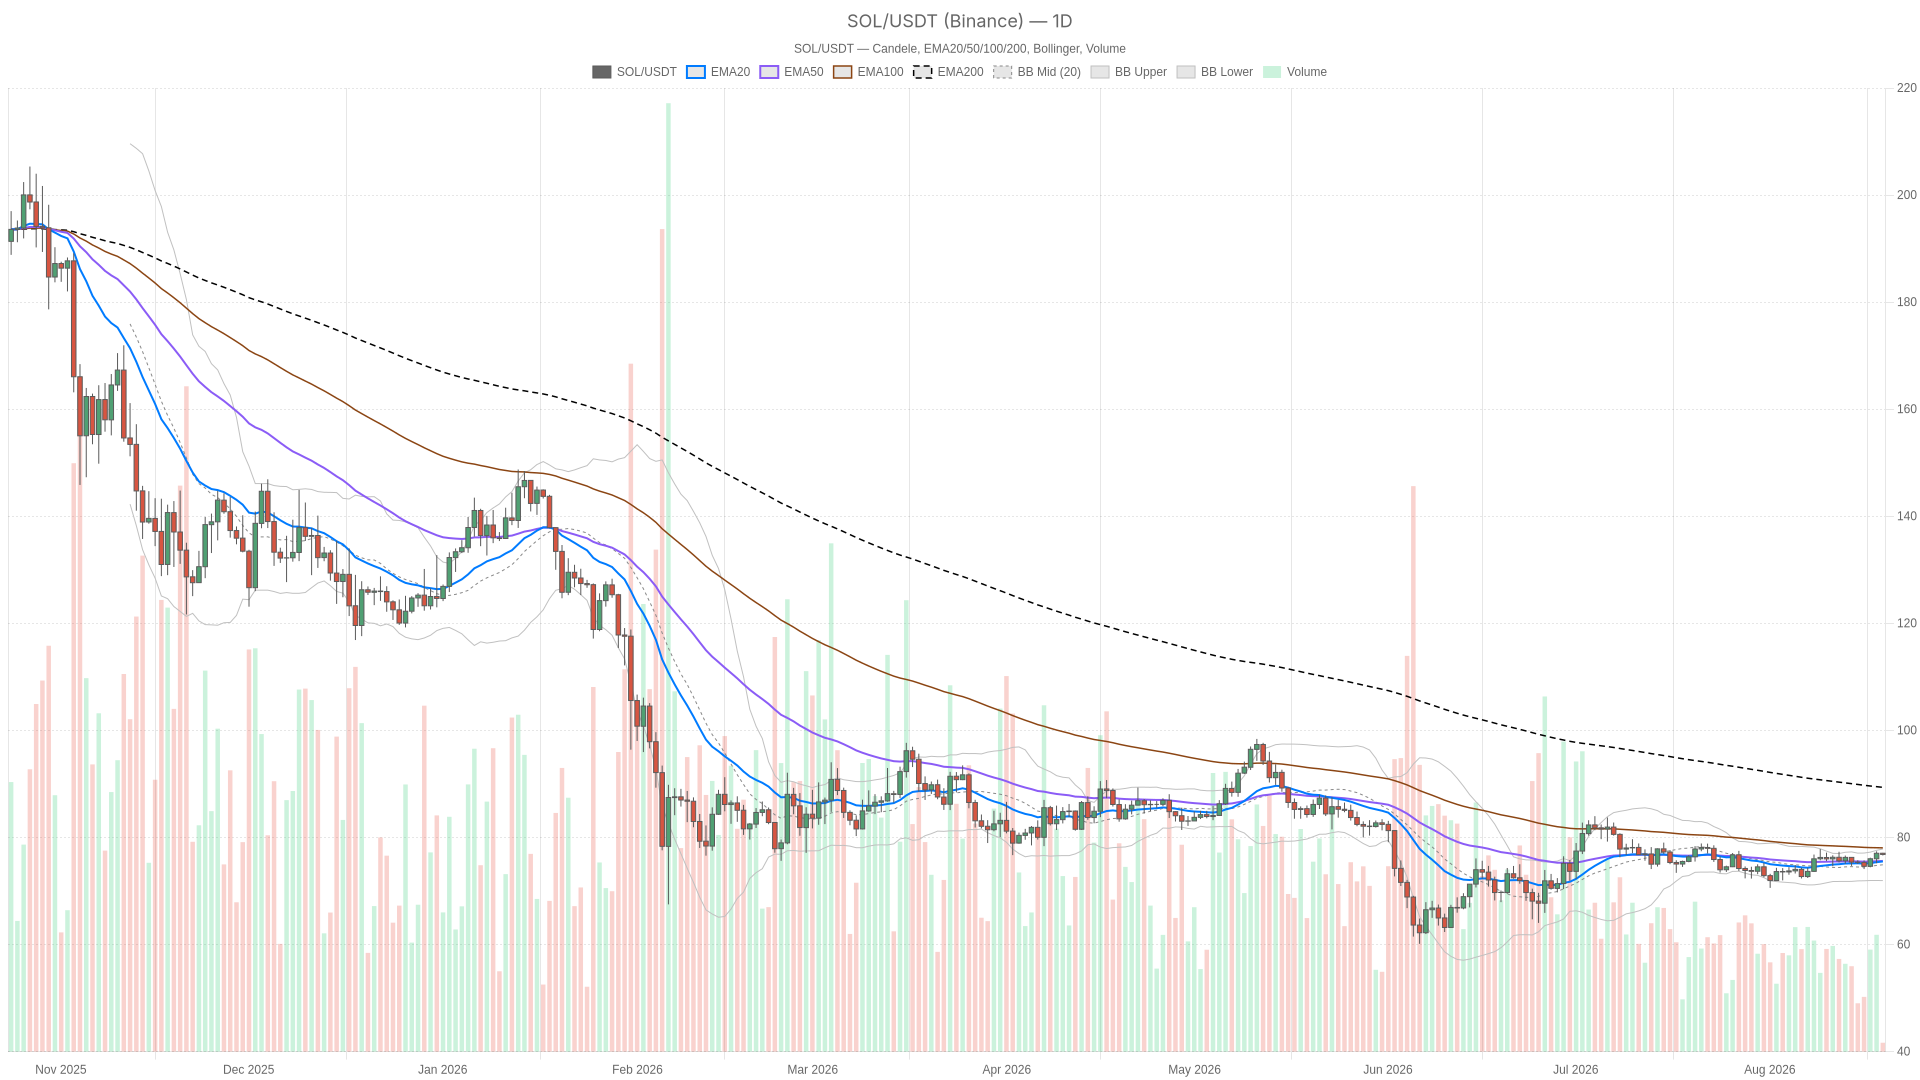
- 日线 EMA200 位于 $89.36,比当前价格高出 $12 以上,确认更广泛的趋势结构仍为看跌。
- 链上活动正在激增:PumpSwap 费用跳涨 87.35%(单日),Raydium AMM 公布的 30 天费用增长为 82.79%。
- 恐惧与贪婪指数(Fear & Greed Index)为 46(恐惧),比特币占有率为 56.55%,暗示对山寨币突破的风险偏好有限。
本质上,目前的主导力量并非清晰的趋势。它是正在恢复的短期结构与尚未修复更大幅度回调造成的损害的日线图之间的拉锯战。理解未来几个时段哪一方能在这场博弈中获胜就是全部关键。
日线结构:表面中性,但 200 EMA 揭示了真实情况
日线形态在技术上被标记为中性,价格走势在表面上也支撑了这一点。SOL 收盘于 $76.83,略高于 EMA20($75.52)和 EMA50($75.62),这两个均线已汇聚成一个紧密的集群,作为直接支撑。RSI14 为 56.22,具有温和的建设性,位于中线之上且未接近超买区域,如果买家坚定入场,仍有运行空间。MACD 线为 0.33,而信号线为 0.08,产生了 0.25 的正柱状图,这是一个不错的信号,表明最近几个时段动能一直在积累而非消退。
然而,这一切都无法改变图表上一个更令人不安的事实:EMA200 高达 $89.36,比当前价格高出 12 美元以上。这种差距意味着在最近的反弹之下,主导的日线趋势结构仍然看跌。我们正在观察的是大跌趋势中的一次恢复尝试,而不是新的上升趋势。布林线(Bollinger Bands)强化了这种挤压,即在乐观与谨慎之间:中轨位于 $74.89,上轨位于 $77.84,下轨位于 $71.95,价格正向近期区间的顶部逼近。日线 ATR14 为 $1.77,确认了波动性依然存在,足以在接下来的几个时段内引发任一方向的决定性波动。
1 小时图:看涨标记,动能略显乏力
缩放到 1 小时时间框架,形态转为看涨,EMA 堆叠也印证了这一点。EMA20 位于 $76.68,EMA50 位于 $76.24,EMA200 位于 $75.70,均以正确的上升趋势顺序排列。RSI14 为 56.13,几乎与日线读数完全一致,这标志着两个时间框架之间的协调而非背离。然而,这里的 MACD 显示出更多谨慎:0.27 的线条已滑落至 0.31 的信号线下方,产生了 -0.03 的轻微负柱状图。这是一个微妙但真实的信号,表明上涨动能正在阻力位附近停滞。
Market Context
Solana
SOL
$106.08
-3.88% (24H)
Market Cap
$62.7B
Circulating Supply
589.2M SOL
24H Volume
$4.2B
24H High
$110.68
Article Intelligence
Key Entities
Raydiumsolana
Related Coverage
 CryptoBitcoin Back to $83,000 but Why Are Ethereum, Solana, XRP Weak?17 分钟前 · 2 min read
 CryptoSolana Cryptocurrency Seizes Opportunity as Hong Kong Unveils Second ETF1 小时前 · 3 min read
Sponsored
Ad
NewsLayerLearn more
NewsLayer Premium
Unlock deeper intelligence.
Ad-free reading, exclusive research, and real-time onchain insights.
Go Premium