
Zora [ZORA] fell 1.51% in 24 hours, but swing traders and investors have reason to adopt a bullish bias. The $34.2 million altcoin gained 27% over seven days and traded 37% above its month-ago price.
Will Zora crypto break $0.0121 resistance? Watch out for THIS major signal
Zora [ZORA] fell 1.51% in 24 hours, but swing traders and investors have reason to adopt a bullish bias. The $34.2 million altcoin gained 27% over seven days and traded 37% above its month-ago price.
AMBCrypto
Publisher
Sep 3, 2026 at 12:00 PM UTC · 2 分钟阅读

翻译中…
Zora’s Base App integration allows creators to monetize their posts. However, Trading Volume dropped 46% over 24 hours as ZORA retraced approximately 36% within three days.
Did the decline signal fading demand, or was the market retesting Zora’s breakout?
The 160% August rally has shifted Zora crypto trends
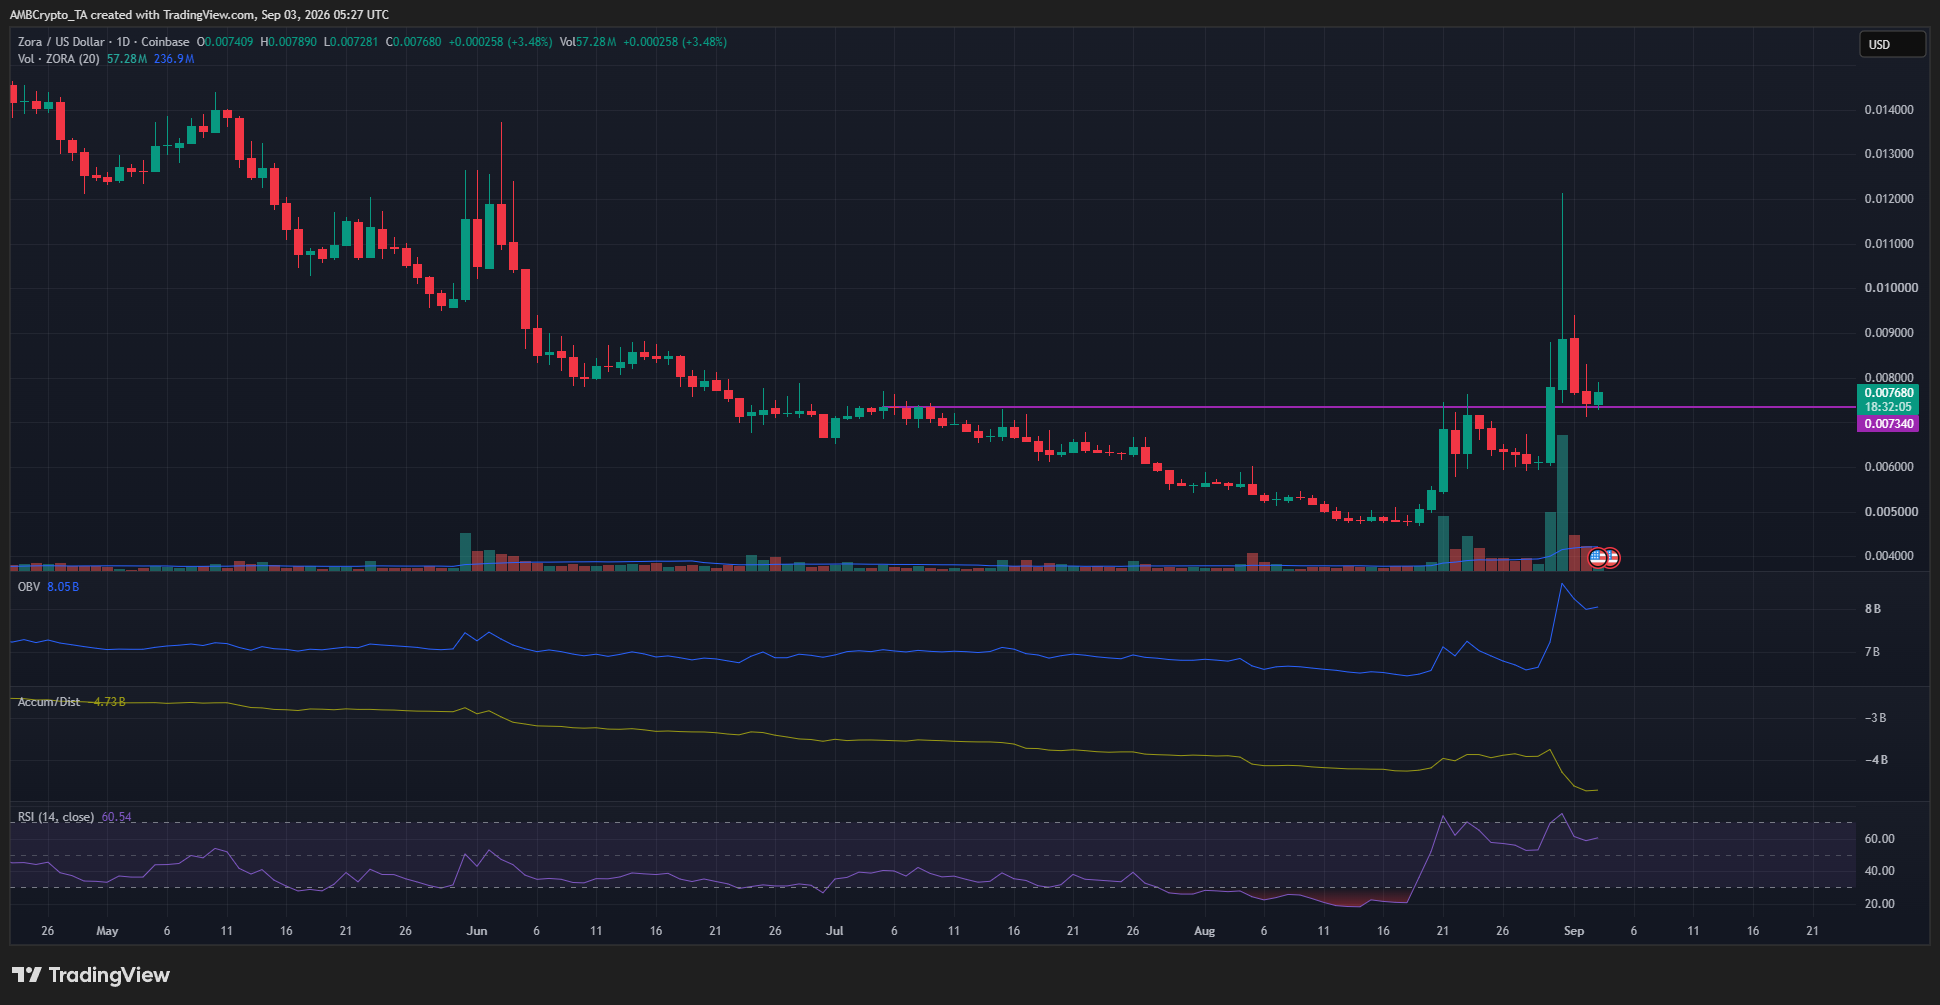
For a year now, Zora crypto has operated within a bearish trend on the 1-day timeframe. Since June, the token has been sliding lower with very few sizeable price bounces, till the one in August.
Using the 1-day timeframe, a lower high (purple) at $0.007 was identified as the latest swing high that kept the bear trend alive.
The latest rally took prices to $0.0121, well past the previous swing high. This move marked a bullish structure shift.
Interestingly, the OBV made new highs and was trending higher while the A/D indicator fell lower. This was a result of how the indicators are calculated and not a divergence. The large upward wick was what caused the A/D indicator’s decline.
Traders’ call to action: Buy
Article Intelligence
Topics
Sponsored
Ad
NewsLayerLearn more
NewsLayer Premium
Unlock deeper intelligence.
Ad-free reading, exclusive research, and real-time onchain insights.
Go Premium