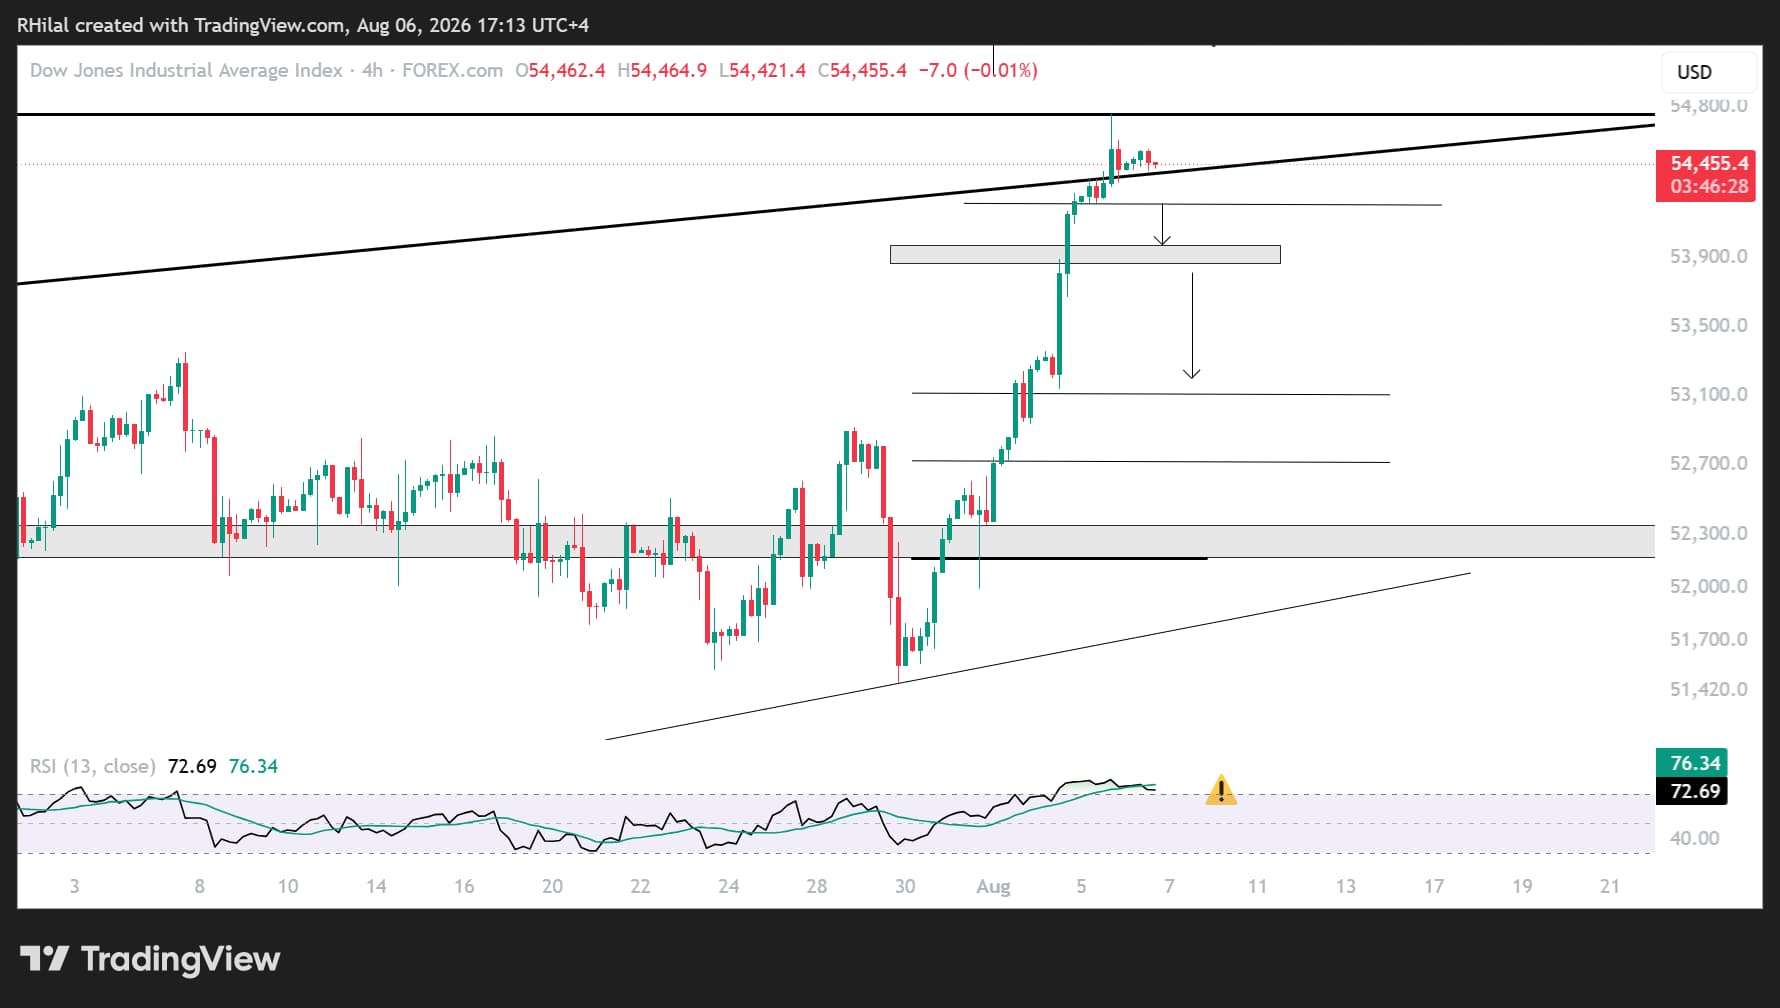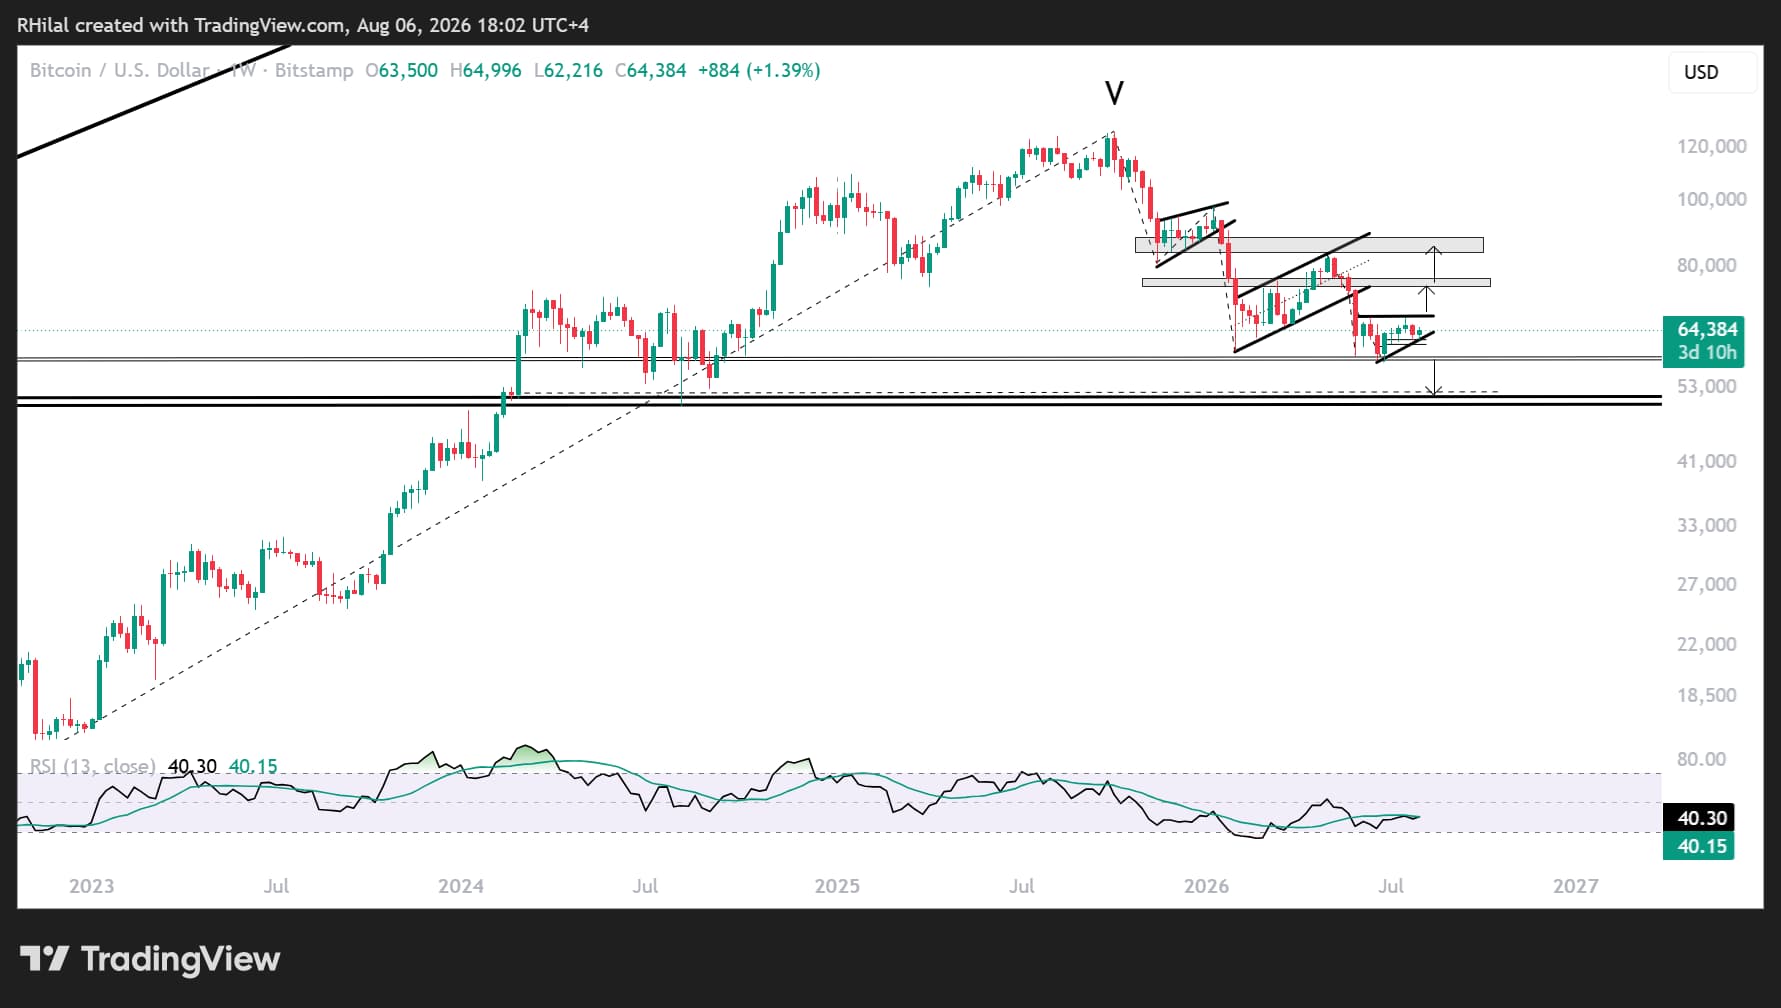
Bitcoin continues to trade below the $67,000 mark despite this week's broad risk-on rally, while the Dow Jones Industrial Average tests a major four-year resistance zone near 54,700, raising questions over whether the current rally can extend or is nearing a period of consolidation.
The Dow Jones was the first major US equity index to lead this week's rally, driven by optimism surrounding a potential US-Iran agreement. However, the index is now testing the upper boundary of its four-year ascending channel while monthly momentum has reached overbought levels last seen in 2018, increasing the risk of a near-term pullback.
A sustained break and close above the 54,700–55,000 resistance zone would instead reinforce the long-term bullish outlook, turning the upper boundary of the ascending channel into a new area of support and opening the door for another leg higher.
Dow Jones Outlook: Monthly Time Frame – Log Scale
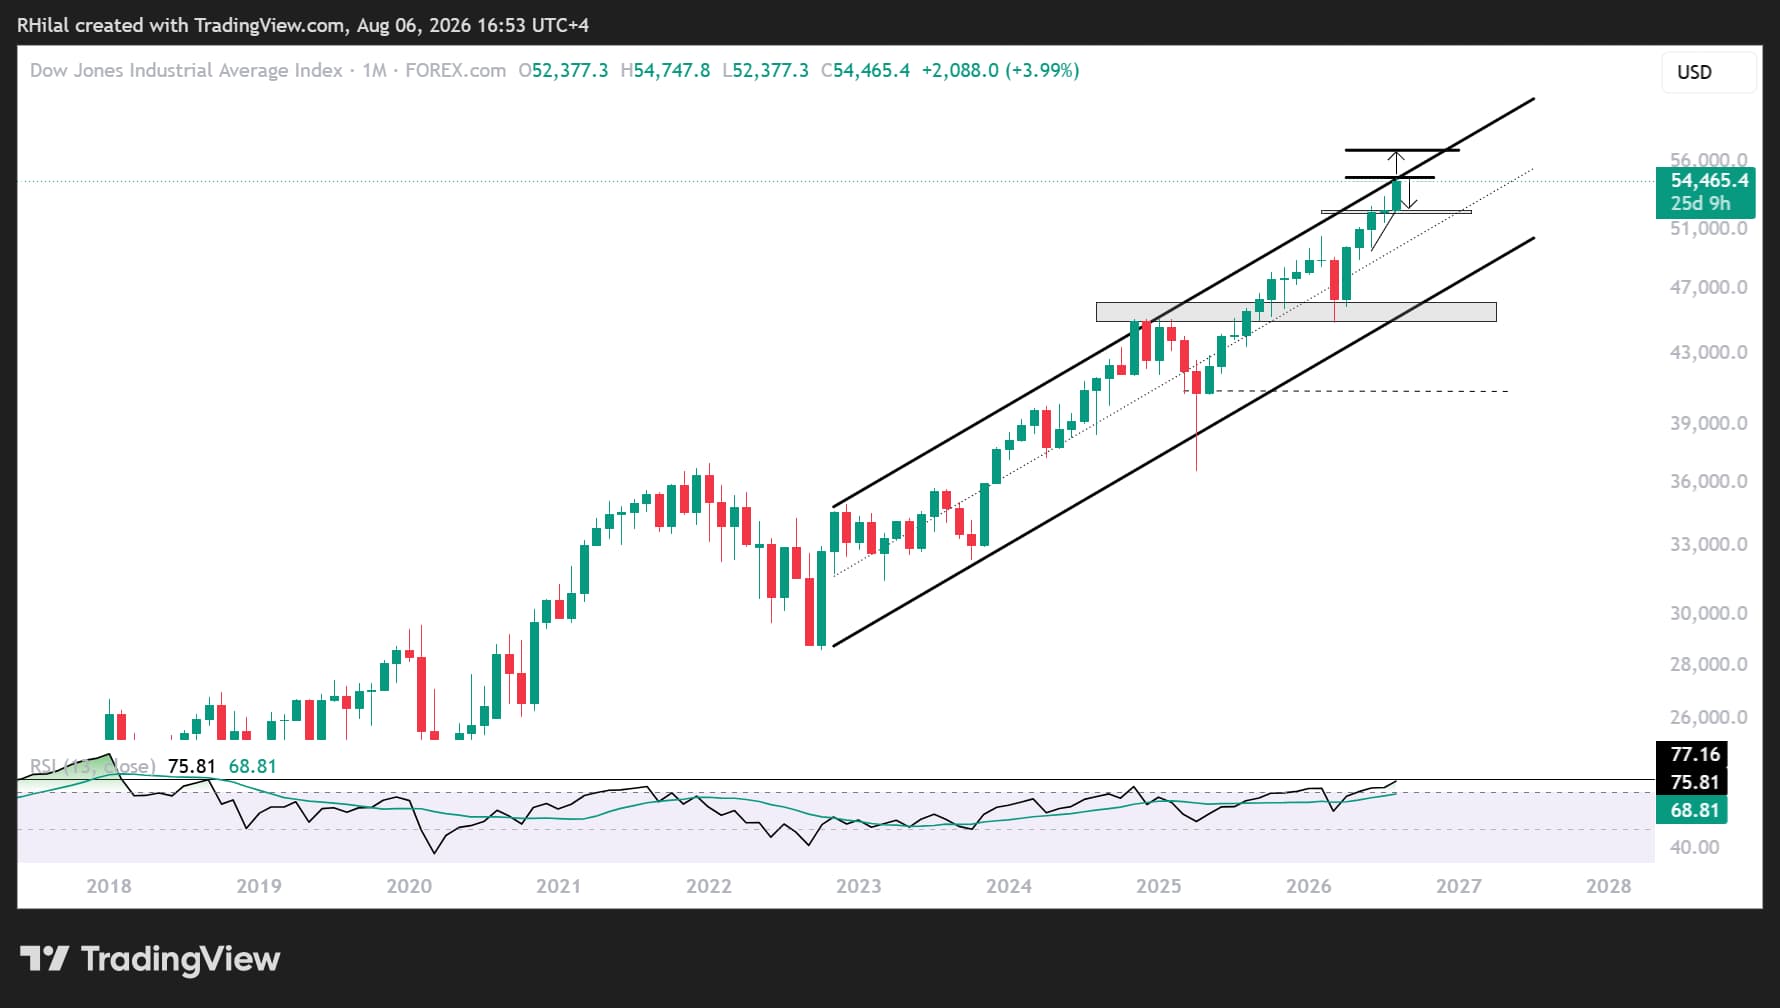
Source: TradingView
Both the weekly and monthly charts suggest that upside momentum is becoming increasingly stretched, with price currently aligning with:
- The upper boundary of the ascending channel that has guided price action since 2022.
- The 100% Fibonacci extension of the April 2025 – January 2026 – March 2026 advance, located near 54,700.
From a fundamental perspective, optimism surrounding a potential US-Iran agreement has improved market sentiment, but no lasting framework has yet been established. As a result, geopolitical risk premiums remain embedded in financial markets, leaving the current rally vulnerable unless the Dow secures a decisive breakout above 55,000.
Should a pullback develop, the August low near 52,400 represents the next major support level, aligning with the 23.6% Fibonacci retracement of the March-August advance.