We use cookies to personalise content and ads, to provide social media features and to analyse our traffic. We also share information about your use of our site with our social media, advertising and analytics partners who may combine it with other information that you’ve provided to them or that they’ve collected from your use of their services.
Necessary cookies help make a website usable by enabling basic functions like page navigation and access to secure areas of the website. The website cannot function properly without these cookies.
_cfuvidThis cookie is a part of the services provided by Cloudflare - Including load-balancing, deliverance of website content and serving DNS connection for website operators.
Maximum Storage Duration: SessionType: HTTP Cookie
__cf_bm [x7]This cookie is used to distinguish between humans and bots. This is beneficial for the website, in order to make valid reports on the use of their website.
CookieConsentStores the user's cookie consent state for the current domain
Maximum Storage Duration: 1 yearType: HTTP Cookie
Preference cookies enable a website to remember information that changes the way the website behaves or looks, like your preferred language or the region that you are in.
We do not use cookies of this type.
Statistic cookies help website owners to understand how visitors interact with websites by collecting and reporting information anonymously.
We do not use cookies of this type.
Marketing cookies are used to track visitors across websites. The intention is to display ads that are relevant and engaging for the individual user and thereby more valuable for publishers and third party advertisers.
We do not use cookies of this type.
Unclassified cookies are cookies that we are in the process of classifying, together with the providers of individual cookies.
List of domains your consent applies to: [#BULK_CONSENT_DOMAINS#]
Cookie declaration last updated on 8/12/26 by Cookiebot
[#IABV2_TITLE#]
[#IABV2_BODY_INTRO#]
[#IABV2_BODY_LEGITIMATE_INTEREST_INTRO#]
[#IABV2_BODY_PREFERENCE_INTRO#]
[#IABV2_BODY_PURPOSES_INTRO#]
[#IABV2_BODY_PURPOSES#]
[#IABV2_BODY_FEATURES_INTRO#]
[#IABV2_BODY_FEATURES#]
[#IABV2_BODY_PARTNERS_INTRO#]
[#IABV2_BODY_PARTNERS#]
About
Cookies are small text files that can be used by websites to make a user's experience more efficient.
The law states that we can store cookies on your device if they are strictly necessary for the operation of this site. For all other types of cookies we need your permission.
This site uses different types of cookies. Some cookies are placed by third party services that appear on our pages.
You can at any time change or withdraw your consent from the Cookie Declaration on our website.
Learn more about who we are, how you can contact us and how we process personal data in our Privacy Policy.
Please state your consent ID and date when you contact us regarding your consent.
Install NewsLayer
Get the app experience — one tap from your home screen, instant loads and breaking-news alerts.
Bitcoin Price Prediction: Will BTC Hold Its Last Support or Flush to $52,000 Before FOMC
The Bitcoin price prediction right now comes down to a single chart level, with $BTC trading at $62,983 directly on the lower boundary of an ascending channel that’s held every pullback since June, and $52,000 as the target if that…
The Bitcoin price prediction right now comes down to a single chart level, with $BTC trading at $62,983 directly on the lower boundary of an ascending channel that’s held every pullback since June, and $52,000 as the target if that boundary fails.
$BTC Price Analysis: Channel Floor or $52,000 — That Is the Only Question Right Now
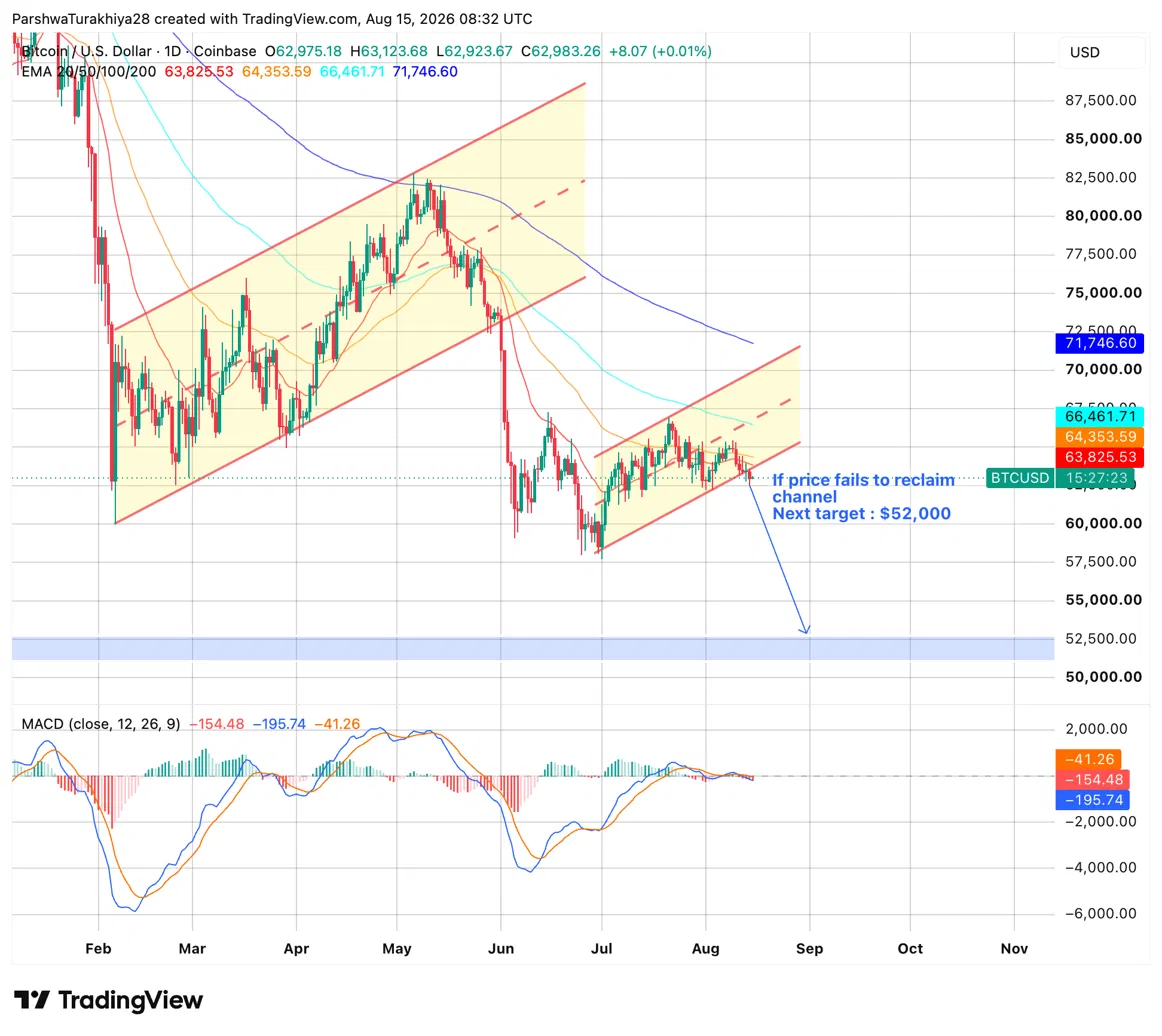
$BTC Price Action (Source: TradingView)
The daily chart shows $BTC pressing the lower trendline of an ascending channel that formed from the June lows near $57,500. The channel has contained every pullback since July, but price is now sitting directly on the lower boundary for the second consecutive session. The chart annotation is direct: if price fails to reclaim the channel, the next target is $52,000.
Today’s session opened at $62,975, pushed briefly to $63,124, and settled at $62,983, well below all four EMAs. The 20-day at $63,826 is the immediate ceiling, followed by the 50-day at $64,354, the 100-day at $66,462, and the 200-day at $71,747. The MACD at -154.48 remains below the signal line at -195.74 with the histogram at -41.26 still negative, meaning momentum has not turned. There is no bullish indicator on this chart right now. Every signal points to sellers being in control and the channel being the only thing preventing a larger move lower.
$BTC Analysis: Leveraged Longs Are Being Flushed Out
CryptoQuant community analyst BorisD flagged on Thursday that leveraged long $BTC positions are being cleaned out as Binance open interest and price fall together. That correlation, which stood at 0.25 as of Thursday, is the key signal. When price and OI fall simultaneously, it means long positions are giving up, getting stopped out, or hitting liquidation rather than new shorts driving the move.
The setup going into this had been building for weeks. While $BTC traded in a narrow range since June, Binance OI had been climbing steadily, reaching $8.15 billion on Wednesday as futures increasingly drove price action while spot traders sat on the sidelines. That accumulation of leveraged longs in the low $60,000 zone created a fragile structure that any downside volatility could unwind quickly.
CoinGlass put total 24-hour cross-crypto liquidations at $236 million, confirming the flush is already underway rather than still pending.
CryptoQuant CEO Ki Young Ju added a broader view, stating that the stars have not aligned for a Bitcoin bull market yet. His on-chain indicator heatmap shows multiple metrics still in bear territory, consistent with what Glassnode has separately described as Bitcoin’s longest capitulation phase since the end of the 2022 bear market.
FOMC Minutes, PCE, and September Hike Odds
The macro story around Bitcoin this cycle is not the familiar one. Rate cuts are off the table. What is actually moving markets is whether the Fed hikes, and that probability has been swinging wildly enough to move $BTC by several percent in either direction within days.
Two weeks ago, CME FedWatch put the odds of a September 16 hike at 82.4%, driven largely by Strait of Hormuz oil supply fears reigniting inflation concern. After softer CPI and PPI data on August 13, those same odds fell to roughly 32% to 35%.
Polymarket currently sits at 52% for at least one hike before year-end versus 48% for none, a coin flip that reflects genuine disagreement inside the Fed itself. At the July 29 meeting, Cleveland’s Beth Hammack, Minneapolis’s Neel Kashkari, and Dallas’s Lorie Logan all voted for an immediate quarter-point hike, the first time three members have broken ranks together on the hawkish side since September 2016.
Related: Bitcoin Price Prediction Drops to $63K as 228K $BTC Floods Binance and ETFs Bleed $332M
Three Dates That Matter More Than Any Price Target
August 19 — FOMC releases minutes from the July 28 to 29 meeting. Markets will parse how close the 9 to 3 vote came to flipping. If the minutes reveal more hawkish discussion than the post-meeting statement suggested, rate-sensitive assets including Bitcoin face an immediate downside reaction.
August 26 — July PCE data, the Fed’s preferred inflation gauge, arrives as the last major inflation read before September. A hot print keeps the hike live. A cool print pushes it back toward the 2027 timeline.
September 16 — The actual FOMC decision, where a hike rather than a cut is the live tail risk. Bitcoin has been trading the change in hike odds, not the hawkish rhetoric itself, so the direction of the September probability between now and then is the number to watch.
$BTC Price Prediction: Upside and Downside Targets
Bullish Case, Target: $66,462 (100-day EMA)
$BTC reclaims the ascending channel on a daily close above $63,500, with the leveraged long cleanout completing rather than accelerating. FOMC minutes on August 19 reveal a less hawkish internal discussion than feared, keeping September hike odds below 30%. Spot buyers step back in as the flush clears overleveraged positions and $BTC pushes toward the 50-day EMA at $64,354 and the 100-day at $66,462.
Bearish Case, Risk Level: $52,000 (Chart Target)
The ascending channel lower boundary fails on a daily close and the leveraged long cleanout accelerates as stops cascade below $61,500. FOMC minutes reveal a closer internal vote than the market priced, pushing September hike odds back above 50%. The $236 million in 24-hour liquidations proves to be the start rather than the end of the flush, and $BTC exits the channel toward the $52,000 target marked on the chart.