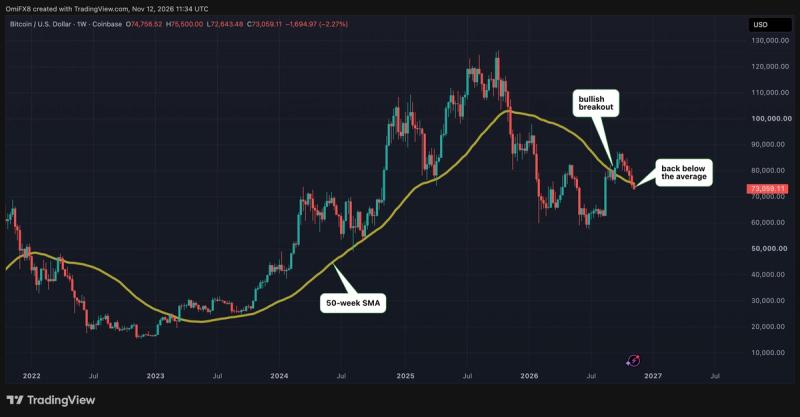
How to read a candlestick chart: patterns and a bitcoin test
CryptoTicker.io
Publisher
Nov 11, 2026 at 7:22 AM UTC · 1 dk okuma

Entities
bitcoin
Market Impact
BTC-1.54%$72,585
Last Updated
bir gün önce
Çevriliyor…
How to read a candlestick chart: patterns and a bitcoin test CryptoTicker.io
Follow the Story
- Nov 11How to read a candlestick chart: patterns and a bitcoin test
- Nov 12Strategy spent more than twice as much on preferred-share buybacks as Bitcoin. Now comes its MSCI exit
- Nov 12Bitcoin slips to about $73,000 as Nvidia CEO turmoil rattles markets
- Nov 12Bitcoin Sinks Below $73,000 on Fresh AI Jitters, Tighter Fed Policy
- Nov 11How to read a candlestick chart: patterns and a bitcoin test
- Nov 12Strategy spent more than twice as much on preferred-share buybacks as Bitcoin. Now comes its MSCI exit
- Nov 12Bitcoin slips to about $73,000 as Nvidia CEO turmoil rattles markets
- Nov 12Bitcoin Sinks Below $73,000 on Fresh AI Jitters, Tighter Fed Policy
Sourced by
Originally reported by CryptoTicker.io
NewsLayer coverage based on externally reported material.
The Daily Brief
The onchain economy, before your day starts.
Curated markets, onchain insights, and key headlines — delivered every weekday morning.
Weekdays · Free · ~5 minute read
0
Applause
Was this article helpful?
Market Context
Bitcoin
BTC
$72,599
-1.53% (24H)
Market Cap
$1.46T
24H Volume
$15.2B
24H High
$74,754
Article Intelligence
Key Entities
Topics
Related Coverage
 CryptoBitcoin faces a $25B Treasury test after demand for US debt weakens3 saat önce · 1 min read
 CryptoSerious Fed Warning Triggers ‘Significant’ Bitcoin Price Flipbir saat önce · 1 min read
 CryptoStrive lifts SATA preferred dividend to 13.25% as Bitcoin stack reaches 43,153 BTCbir saat önce · 1 min read
Sponsored
Ad
NewsLayerLearn more
NewsLayer Premium
Unlock deeper intelligence.
Ad-free reading, exclusive research, and real-time onchain insights.
Go Premium