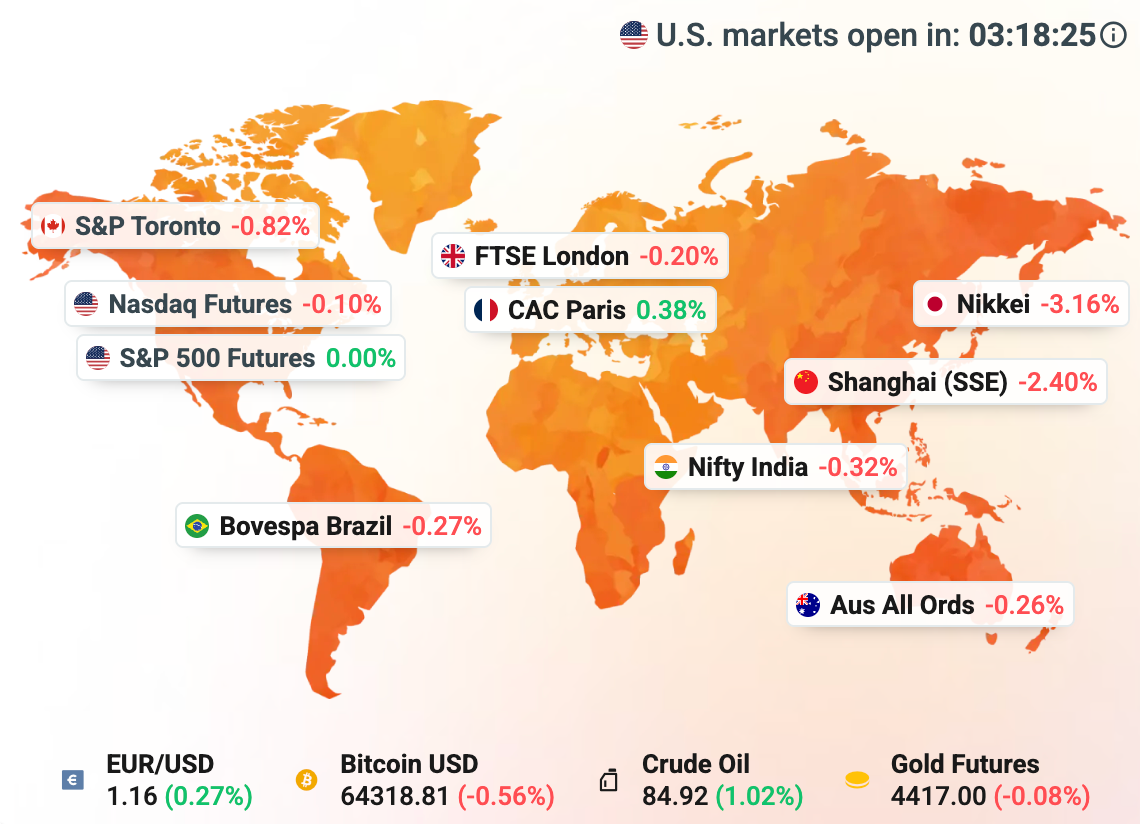
Bitcoin trades near the $64,300 level as the U.S.-Iran tensions have reduced the demand for risky assets. The conflict has supported gold but has not created the same safe haven demand for Bitcoin. But the geopolitical situation is still unclear and Bitcoin has been stable above the $60,000 level.
U.S. spot Bitcoin ETFs also saw net inflows of $297.5 million on 17 August and $189.3 million on 18 August. While these inflows can help in the short term, the technical breakout is still required to confirm higher institutional demand.
The Fed minutes could determine the next move in both markets. Investors currently expect 65% chance that the Fed will leave interest rates unchanged in September and a 35% chance it will raise rates. A less hawkish message would weaken the US dollar and support both assets. But the higher oil prices can boost inflation expectations. This may push bond yields higher and adversely affect BTC as it is still risk sensitive. Gold may perform better if the geopolitical tensions continue to rise.
Bitcoin Price Forecast: Can BTC Break Above $67,000?
The weekly chart for Bitcoin shows that the price formed bear flag pattern from November 2025 to January 2026. The breakdown from this bear flag pushed the price to form a low at the $60,000 level in February 2026. After this, the price rebounded to form another bear flag pattern from February to May 2026. A break from this bear flag pattern again pushed the price lower but the price did not break the $60,000 level this time and consolidated within the red-highlighted region.