This website uses cookies
We use cookies to personalise content and ads, to provide social media features and to analyse our traffic. We also share information about your use of our site with our social media, advertising and analytics partners who may combine it with other information that you’ve provided to them or that they’ve collected from your use of their services.
Consent Selection
Details
  • Necessary cookies help make a website usable by enabling basic functions like page navigation and access to secure areas of the website. The website cannot function properly without these cookies.
  • Preference cookies enable a website to remember information that changes the way the website behaves or looks, like your preferred language or the region that you are in.
    • We do not use cookies of this type.

  • Statistic cookies help website owners to understand how visitors interact with websites by collecting and reporting information anonymously.
    • We do not use cookies of this type.

  • Marketing cookies are used to track visitors across websites. The intention is to display ads that are relevant and engaging for the individual user and thereby more valuable for publishers and third party advertisers.
    • We do not use cookies of this type.

  • Unclassified cookies are cookies that we are in the process of classifying, together with the providers of individual cookies.
    • __emg_sidPending
      Maximum Storage Duration: 1 dayType: HTTP Cookie
      __emg_vidPending
      Maximum Storage Duration: 1 yearType: HTTP Cookie
      nl-read-countPending
      Maximum Storage Duration: PersistentType: HTML Local Storage
Cookie declaration last updated on 8/12/26 by Cookiebot
[#IABV2_TITLE#]
[#IABV2_BODY_INTRO#]
[#IABV2_BODY_LEGITIMATE_INTEREST_INTRO#]
[#IABV2_BODY_PREFERENCE_INTRO#]
[#IABV2_BODY_PURPOSES_INTRO#]
[#IABV2_BODY_PURPOSES#]
[#IABV2_BODY_FEATURES_INTRO#]
[#IABV2_BODY_FEATURES#]
[#IABV2_BODY_PARTNERS_INTRO#]
[#IABV2_BODY_PARTNERS#]
About
Cookies are small text files that can be used by websites to make a user's experience more efficient.

The law states that we can store cookies on your device if they are strictly necessary for the operation of this site. For all other types of cookies we need your permission.

This site uses different types of cookies. Some cookies are placed by third party services that appear on our pages.

You can at any time change or withdraw your consent from the Cookie Declaration on our website.

Learn more about who we are, how you can contact us and how we process personal data in our Privacy Policy.

Please state your consent ID and date when you contact us regarding your consent.
NewsLayer

Install NewsLayer

Get the app experience — one tap from your home screen, instant loads and breaking-news alerts.

NewsLayer.com
NewsLayer PulseLIVEBTC$63,369-0.07%ETH$1,885+0.39%SOL$76.12+0.74%XRP$1.01+0.44%DOGE$0.0702+0.90%ADA$0.1818-0.30%Total Cap$2.27T-0.04%Layer Index43 Neutral
External ReportingĐăng một ngày trước

Virtuals Protocol Crypto Nears $0.63 Resistance as RSI Hits Overbought

Markets often reveal their hand at inflection points, and on August 12, 2026, Virtuals Protocol crypto sits at precisely such a juncture. Price has climbed to 0.60 against $USDT, pressing into the upper daily Bollinger Band while the…

Virtuals Protocol Crypto Nears $0.63 Resistance as RSI Hits Overbought
Source Cryptonews.net 8 phút đọc
Image via Cryptonews.net

Layer Index

43

↑ 8 pts in 24h

Markets often reveal their hand at inflection points, and on August 12, 2026, Virtuals Protocol crypto sits at precisely such a juncture. Price has climbed to 0.60 against $USDT, pressing into the upper daily Bollinger Band while the broader chart still carries the scars of a longer corrective phase.

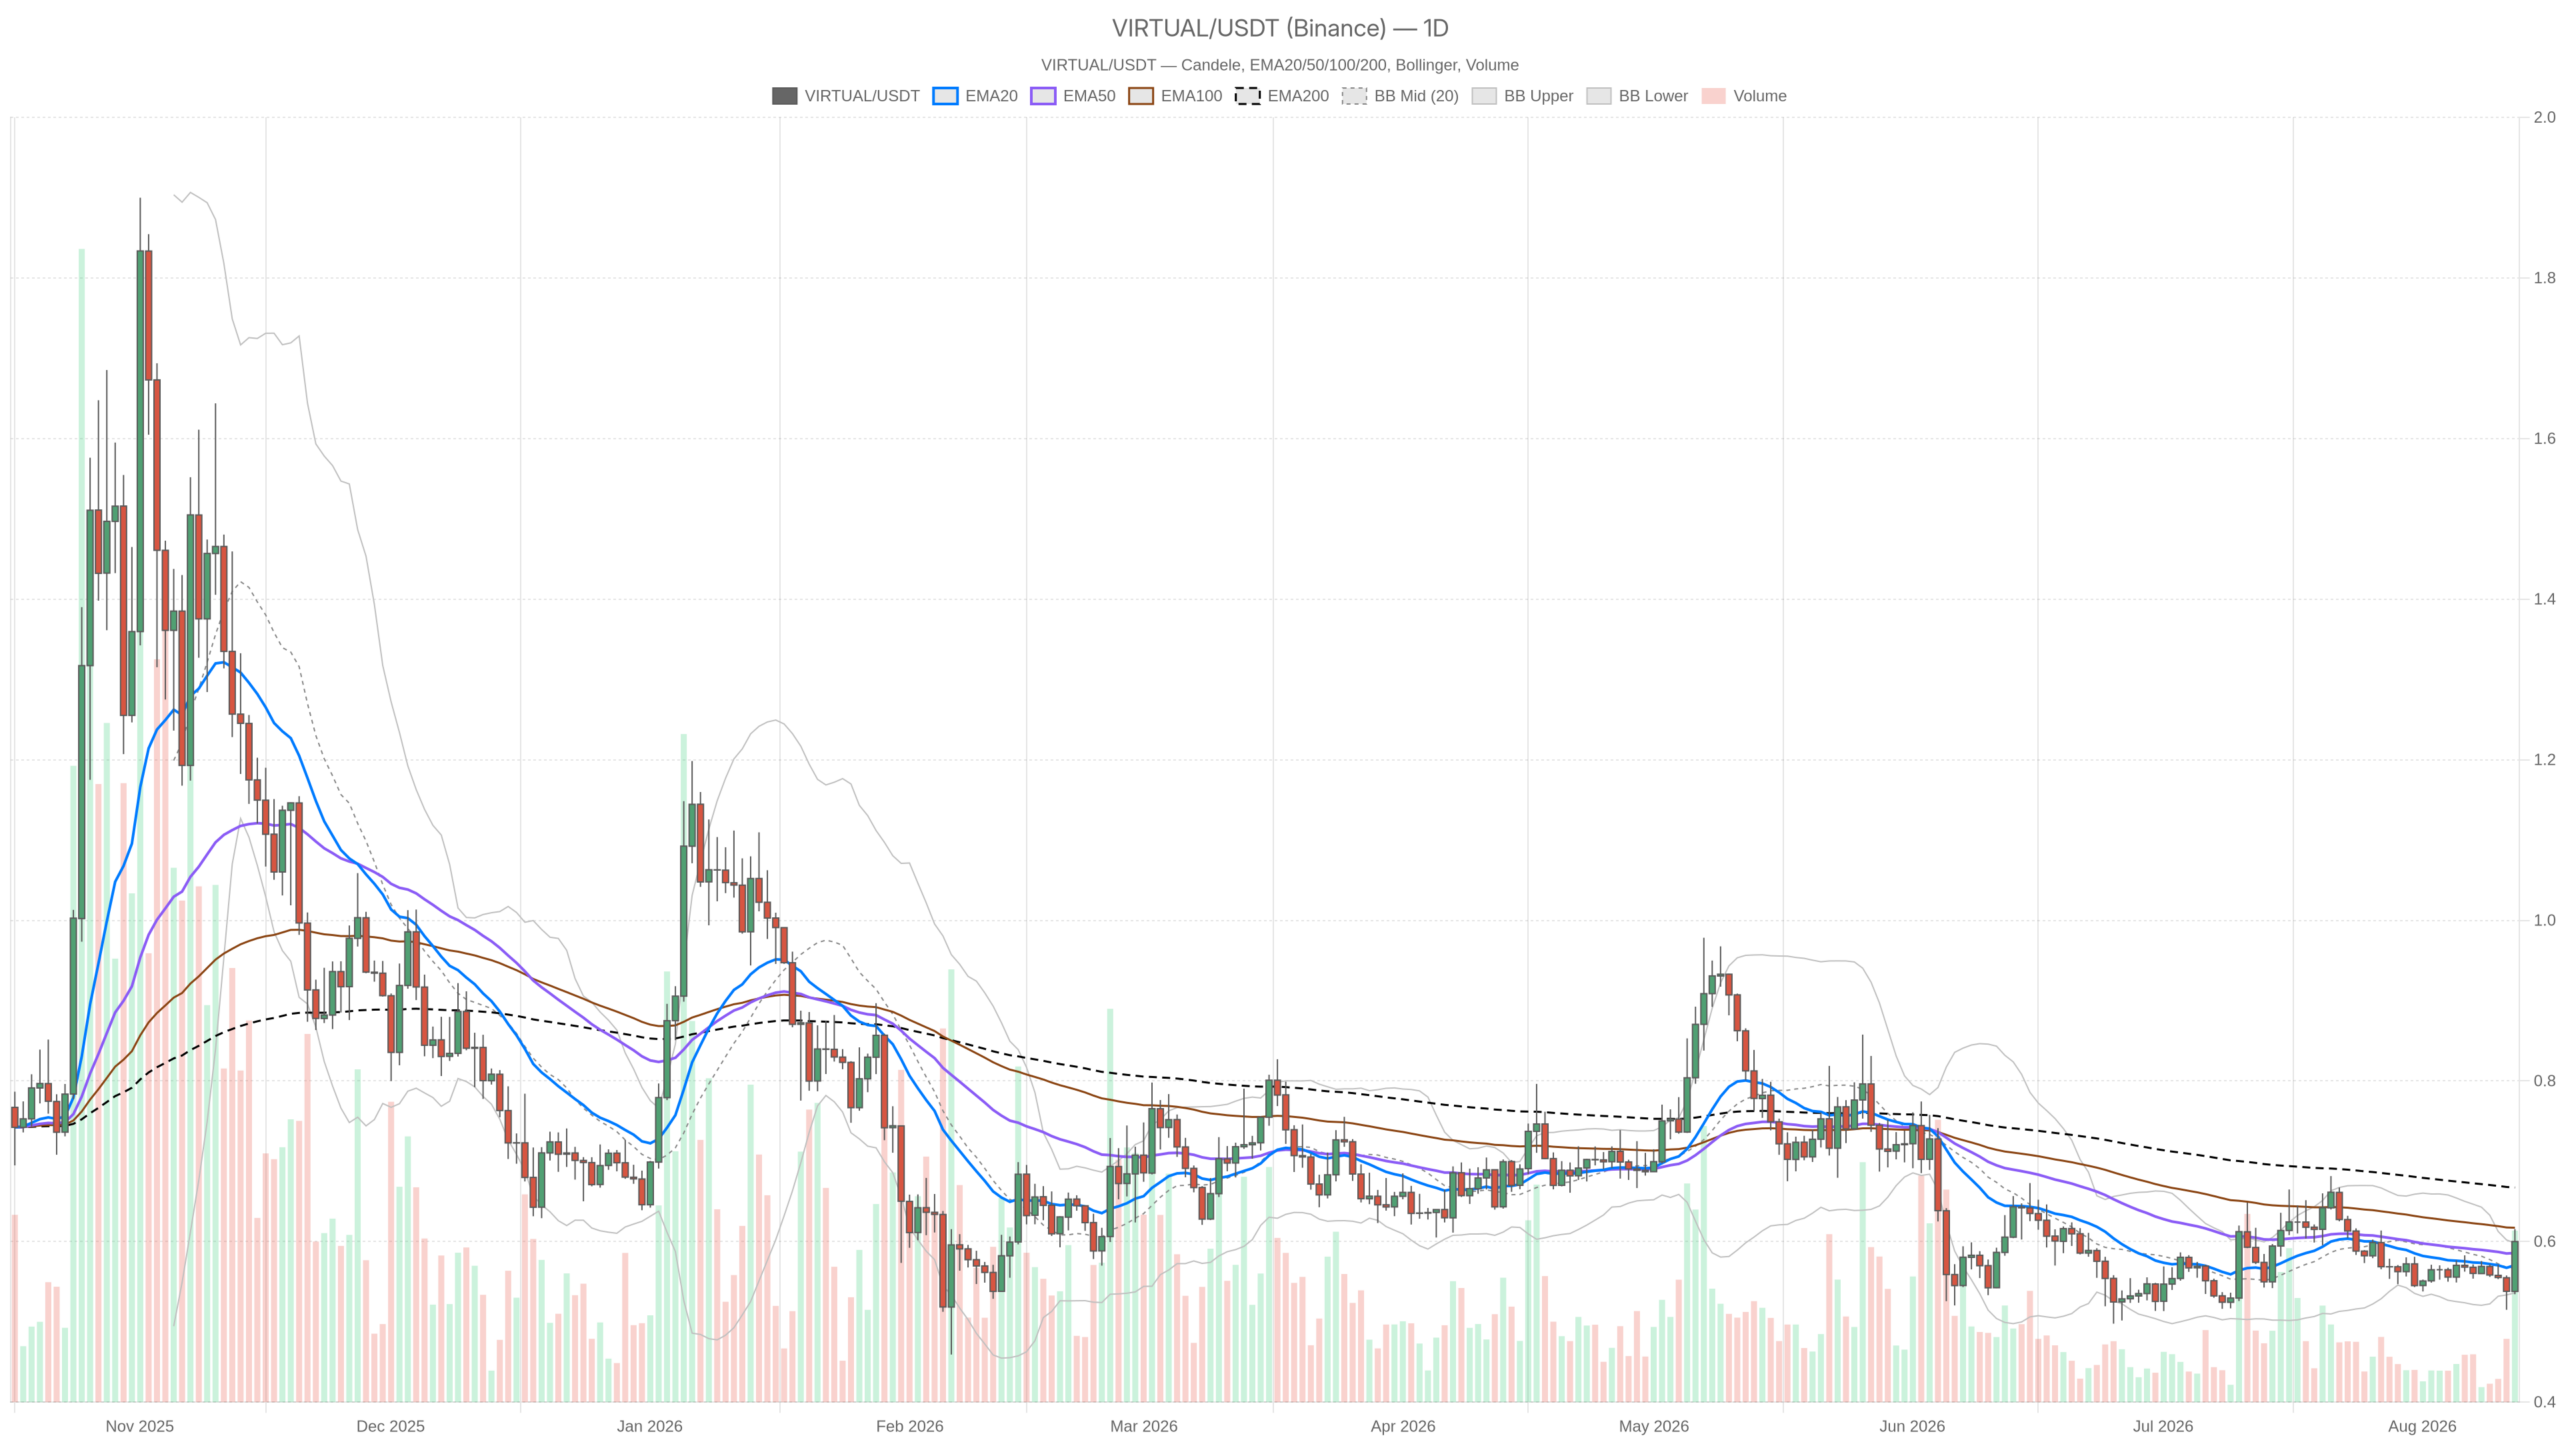
$VIRTUAL/$USDT — daily chart with candlesticks, EMA20/EMA50 and volume.

Key takeaways

  • $VIRTUAL trades at $0.60, pressing the upper daily Bollinger Band while remaining about 10% below its 200-period EMA at $0.67.
  • The 1H chart shows an overbought RSI of 70.39, suggesting the intraday rally may be stretched.
  • Broader sentiment remains cautious with the Fear & Greed Index at 27 and Bitcoin dominance at 56.19%.
  • Daily R1 resistance at $0.63 is the critical level bulls need to reclaim for a confirmed breakout.
  • Daily MACD sits flat with a zero histogram, indicating a market that is stabilizing rather than trending.

What the Daily Chart Reveals

The daily chart reveals a market stabilizing under resistance, with price above short-term moving averages but still well below the long-term trend indicator. On the daily timeframe, $VIRTUAL closed at $0.60, above its EMA20 at $0.57 and EMA50 at $0.59. However, it remains well under the EMA200 at $0.67. This is the key structural fact: short-term moving averages have flipped supportive, but the long-term trend average stays overhead. That keeps the macro bias defined as corrective-to-neutral rather than outright bullish.

RSI14 on the daily sits at 56.38. Moreover, it is the kind of reading that says buyers have the edge but have not forced anything decisive yet. The daily MACD is essentially flat, with the line and signal both at -0.01 and a histogram of zero. Momentum on the higher timeframe sits right at the pivot between negative and positive. It has not confirmed a bullish cross, but it is no longer accelerating lower either.

Bollinger Bands on the daily chart show the mid-band at $0.57, the upper band at $0.60, and the lower band at $0.54. That said, price sitting right at the upper band is typically a short-term overextension signal. It is not a reason to panic, but a reason to expect either a breakout attempt or a pullback toward the mid-band. Daily ATR14 at $0.03 tells you volatility is moderate relative to price, so moves in either direction should not be violent, just directional.

The daily pivot structure reinforces the decision-point narrative. The pivot sits at $0.58, resistance R1 at $0.63, and support S1 at $0.55. Price trading above the pivot is a mildly bullish signal. However, R1 at $0.63 is the level that would actually confirm strength. Until then, the daily chart describes a market that is cautiously testing rather than breaking out.

Intraday Momentum Outpacing the Daily Trend

The 1H and 15-minute charts reveal an aggressive bullish push that has already reached overbought levels, suggesting the rally may be running ahead of the broader market structure. Zooming into the 1H chart, the picture gets noticeably more aggressive. Price at $0.60 trades above all three EMAs. The 20 sits at $0.57, the 50 at $0.56, and the 200 at $0.56. That is a textbook bullish stack for the intraday timeframe. RSI14 on the 1H sits at 70.39, firmly in overbought territory.

This does not automatically signal a reversal, but it does mean the current push has already covered significant ground. Chasing at this level carries more risk than it did a few hours ago. MACD on the 1H is positive and rising, with the line at 0.02, signal at 0.01, and histogram at 0.01. This confirms the intraday bullish momentum is real, not just noise. The 1H Bollinger Bands show the mid-band at $0.56 and the upper band at $0.61, with price once again pressing close to the upper boundary, echoing the daily setup.

Moreover, the 1H pivot levels tell an interesting story. Pivot, R1, and S1 are all clustered at $0.60, meaning price sits almost exactly on top of its own equilibrium. There is very little room before the next decision. That kind of compression often precedes a short, sharp move rather than a slow grind. On the 15-minute chart, the regime is explicitly tagged bullish, with all EMAs stacked correctly beneath price.

However, a subtle but important detail emerges on the fastest timeframe. RSI14 at 63.99 is warm but not extreme, and MACD is only marginally positive at 0.01/0.01 with a flat histogram at zero. Momentum here is decelerating even as the trend label remains bullish. The 15-minute chart is already showing signs of losing steam while technically still in an uptrend, a divergence worth noting.

Reading the Broader Market Backdrop

The broader market backdrop shows cautious sentiment, with the Fear & Greed Index in Fear territory and Bitcoin dominance elevated, creating headwinds for altcoin breakouts. Context matters here. The Fear & Greed Index sits at 27, classified as Fear, even though total crypto market cap is up a modest 0.34% over 24 hours, based on CoinGecko figures. Bitcoin dominance at 56.19% suggests capital remains concentrated in BTC rather than rotating aggressively into altcoins. That is generally a headwind for a name like Virtuals Protocol crypto trying to sustain a breakout.

On-chain activity sends mixed signals too. DEX fee data shows Uniswap V3 up 13.51% over 7 days and 49.81% over 30 days, while Fluid DEX surged 96.17% over the past week, according to DefiLlama-style fee tracking. These are signs of real trading activity picking up in parts of DeFi. Yet Curve DEX fees dropped 62.63% over 7 days and Ekubo fell 51.69% over the same period.

The risk appetite showing up on-chain is uneven, not broad-based. That inconsistency lines up with what the charts are showing: pockets of strength, not a uniform risk-on wave. There is also a regulatory undercurrent worth noting. Nigeria has moved to tighten rules on virtual assets specifically to boost tax revenue, per Bloomberg reporting from early August. Separately, Bloomberg covered renewed concern around offline Bitcoin holdings being drained by hackers.

Neither story is about $VIRTUAL directly, but both feed into the same cautious sentiment backdrop reflected in that Fear & Greed reading. Regulatory friction and security headlines do not help speculative altcoin flows. When the macro mood is fearful and on-chain activity is inconsistent, breakouts tend to face more scrutiny and require stronger confirmation than they would in a risk-on environment.

Bullish Scenario

For a confirmed bullish breakout, $VIRTUAL must close above the daily R1 resistance at $0.63 with positive MACD confirmation. The bullish case needs price to clear and hold above that level, ideally with the daily MACD histogram turning positive to confirm the momentum shift. If that happens while the 1H RSI stays elevated without collapsing, the next logical target becomes a retest of the daily EMA50 zone and eventually a look at the EMA200 at $0.67.

What would invalidate this scenario is a rejection at the current $0.60 area. If price gets pushed back below the daily pivot at $0.58, that would suggest the breakout attempt failed. Buyers would have run out of ammunition at exactly the level they needed to clear. Until a daily close above $0.63 materializes, the bullish case remains speculative rather than confirmed.

Bearish Scenario

The bearish case centers on price remaining below the daily EMA200 at $0.67, with overbought intraday conditions increasing the risk of a pullback toward $0.55 support. The longer-term trend has not actually turned. With the 1H RSI at 70.39 already overbought and the 15-minute MACD losing momentum, a pullback toward the daily EMA20 and Bollinger mid-band around $0.57 becomes a realistic scenario. A deeper move to the daily S1 support at $0.55 is also possible if intraday buyers step back.

A clean break below $0.55 would open the door to retesting lower structure. That would effectively end the current bounce narrative. What invalidates this bearish read is a daily close that holds firmly above $0.60, with the daily MACD line crossing above its signal. That would be the first real sign the corrective phase is actually ending rather than pausing. Until then, the bears have structural justification on their side.

Positioning and Risk

The current setup places $VIRTUAL between a cautiously neutral daily chart and overheated intraday timeframes, making this a high-uncertainty environment where the daily close matters more than intraday noise. Right now, $VIRTUAL is caught between two conflicting signals. That is not a comfortable setup for conviction trades in either direction. It is the kind of environment where the reward for being early can be real, but so can the cost of being wrong about which timeframe ultimately wins.

Daily ATR of $0.03 suggests the swings ahead should not be extreme. However, with RSI already stretched on the 1H and broader sentiment sitting in Fear territory, volatility around the $0.60 to $0.63 zone is the more likely near-term outcome than a smooth continuation. Anyone watching this setup should pay closer attention to whether the daily can actually close above R1, rather than reacting to the intraday noise underneath it. The higher timeframe is still the one that decides whether this is a real move or just a bounce inside a bigger range.

FAQ

What is the key resistance level $VIRTUAL needs to break?

The critical level is the daily R1 resistance at $0.63. A daily close above this level, ideally with the MACD histogram turning positive, would confirm a bullish breakout and open the path toward the EMA200 at $0.67.

Is $VIRTUAL currently in a bullish or bearish trend?

The daily chart remains corrective-to-neutral. While short-term moving averages have flipped supportive, price still trades roughly 10% below the 200-period EMA at $0.67. The longer-term trend has not yet turned bullish.

What does the overbought RSI on the 1H chart signal?

An RSI of 70.39 on the 1H chart indicates the intraday rally has already covered significant ground and may be stretched. It does not guarantee a reversal, but it does suggest that chasing the move at current levels carries elevated risk compared to earlier entry points.


Disclaimer: This article is for informational purposes only and does not constitute financial advice, an investment recommendation, or a solicitation to buy or sell any financial instrument or cryptocurrency. The analysis provided is not indicative of future results. Investing in crypto assets and financial markets carries a high risk of capital loss. Always do your own research (DYOR) and consult a qualified financial advisor before making any decision.

Article produced with the assistance of artificial intelligence and reviewed by the editorial team.

Attribution

Originally reported by Cryptonews.net

Get stories like this, daily.

Daily crypto + regulation intelligence, straight to your inbox. Free.

Tin Liên Quan