比特币 最近的价格飙升引发了一个可能实现更大涨幅的看涨信号。
Bitcoin 刚刚突破了一条关键的长期均线。这可能意味着什么
Bitcoin 刚刚突破了一条关键的长期均线。这可能意味着什么
Olivier Acuna
Publisher CoinDesk
Sep 24, 2026 at 6:46 PM UTC · 1 分钟阅读
Key Signal
$80,900 365-day average level
Entities
bitcoin
Market Impact
BTC-0.35%$84,055
Last Updated
1 天前
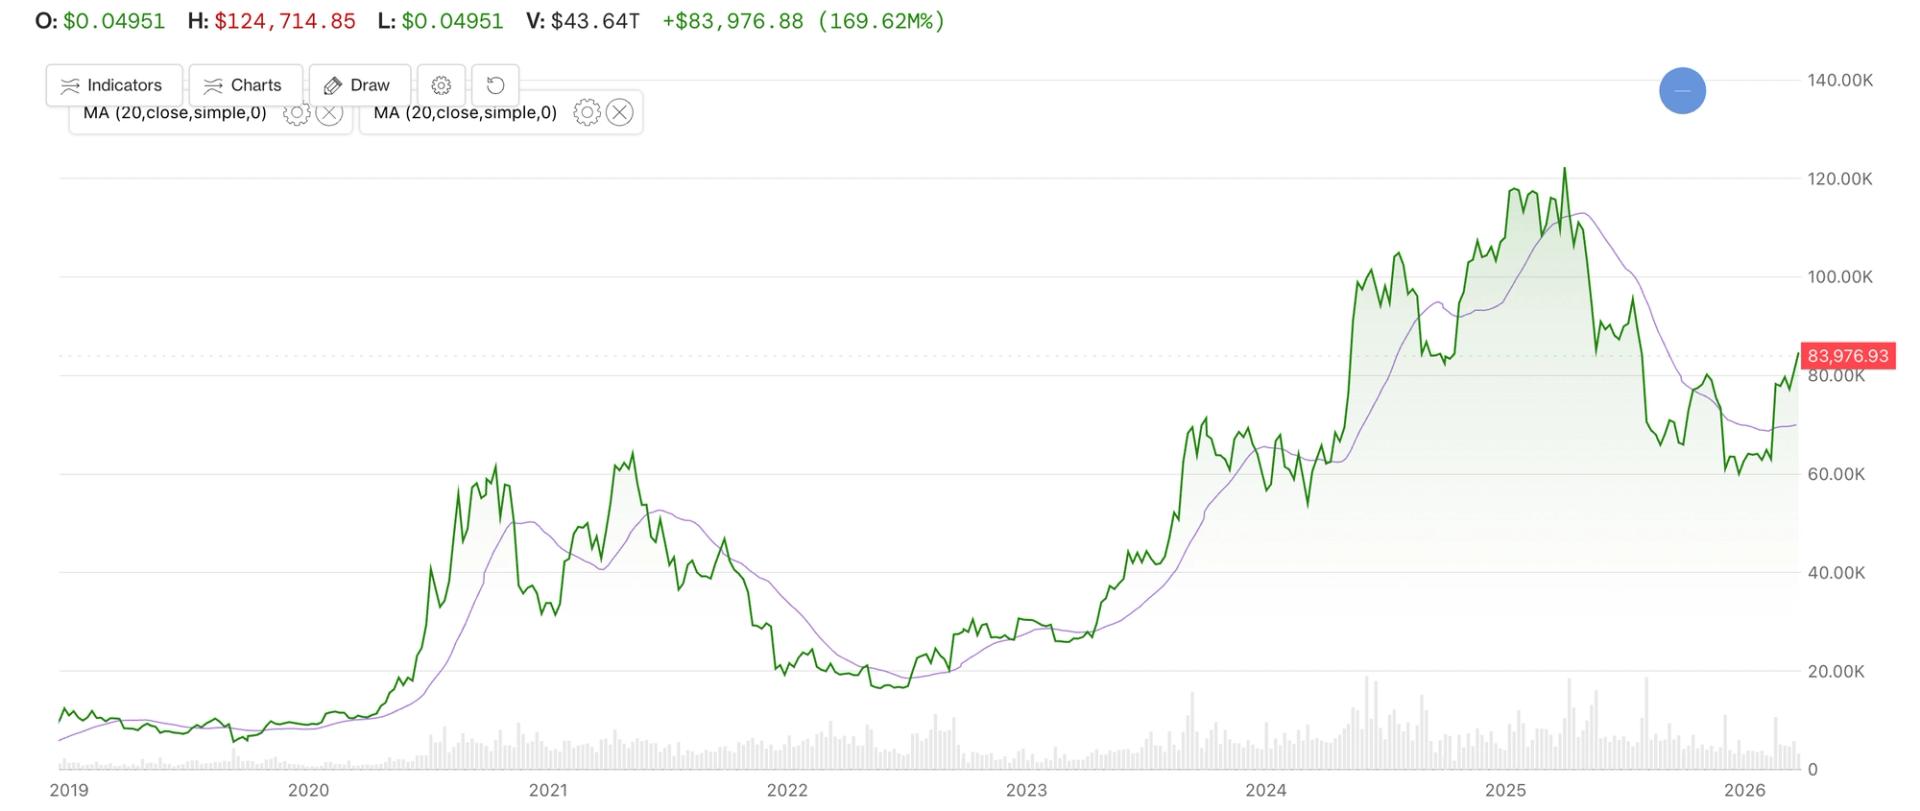
该信号是价格突破其365天滚动简单移动平均线。
在9月22日,比特币在310天内首次升至其365天均线(约$80,900附近)上方,Altcoin Pro创始人Ryan Horst和Joni Zhuleku在一次邮件对话中表示。
Altcoin Pro发现,在之前的五次比特币在低于其365天均线至少90天后重新夺回该均线的情况下,12个月后比特币的价格均有所上涨。涨幅从约59%到超过1,400%不等,尽管最大的涨幅出现在2012年,当时比特币还是一种边缘资产。
Horst表示,这种模式并非万无一失。当该公司将线下的较短周期计算在内时,发现了两次失败的突破,分别是在2018年7月和2022年3月,当时比特币在90天内分别下跌了约27%和59%。
“今年9月的走势令人鼓舞,特别是在均线下方停留310天之后,但我们希望看到它能持稳,”Horst说。“这是一个信号,而非保证。”
Follow the Story
Sourced by
Originally reported by CoinDesk
NewsLayer coverage based on externally reported material.
The Daily Brief
The onchain economy, before your day starts.
Curated markets, onchain insights, and key headlines — delivered every weekday morning.
Weekdays · Free · ~5 minute read
0
Applause
Was this article helpful?
Market Context
Bitcoin
BTC
$84,056
-0.35% (24H)
Market Cap
$1.69T
24H Volume
$26.1B
24H High
$85,247
Article Intelligence
Key Entities
Topics
Related Coverage
 CryptoBitcoin Forecast: What to Check on Levels, Holding Period and Buying Route Before the Quarter Ends2 小时前 · 14 min read
 CryptoNorth Korean Hackers Linked to $388M Bitget Crypto Exchange Theft: CEO21 分钟前 · 2 min read
Sponsored
Ad
NewsLayerLearn more
NewsLayer Premium
Unlock deeper intelligence.
Ad-free reading, exclusive research, and real-time onchain insights.
Go Premium