
Bitcoin price risks $78,000 as bearish MACD crossover forms
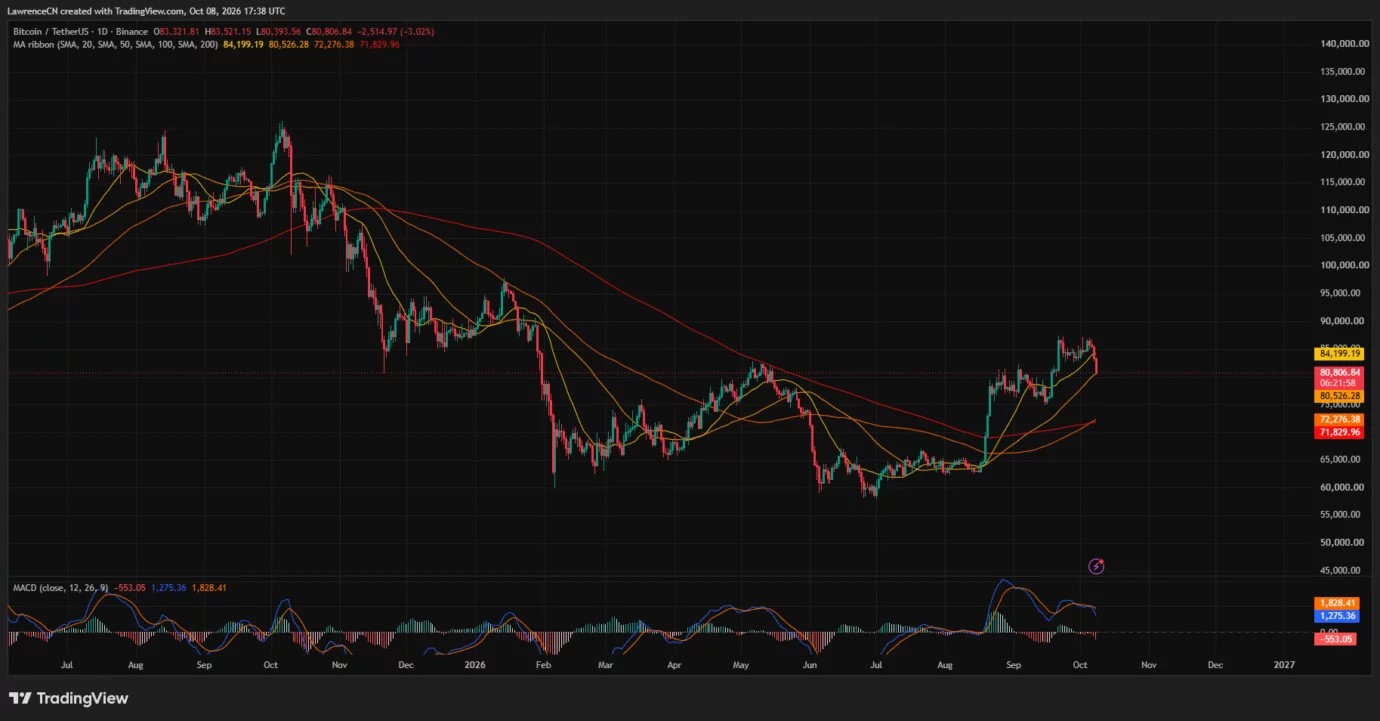
On TradingView’s daily chart, Bitcoin’s 50-day simple moving average stood at $80,526, just below the latest price. The session’s low briefly moved beneath that average before $BTC returned above it.
Cryptonews.net
Publisher
Oct 8, 2026 at 10:00 PM UTC · 4 分钟阅读
Key Signal
$80,832 Bitcoin four-hour price
Entities
bitcoin
Market Impact
BTC+0.55%$82,568
Last Updated
15 小时前
翻译中…
On TradingView’s daily chart, Bitcoin’s 50-day simple moving average stood at $80,526, just below the latest price. The session’s low briefly moved beneath that average before $BTC returned above it.
The 20-day moving average stood considerably higher at $84,199. Based on those readings, Bitcoin would need to recover roughly 4.2% from $80,806 to regain its short-term average.
The gap between the two averages places Bitcoin at a technical decision point. Holding the 50-day average would preserve that support reference, while a sustained break below it would leave the round-number $80,000 level as the next nearby test.
TradingView’s daily price history shows earlier trading activity around $78,000–$80,000 during August and September. Beneath that range, the chart contains another area of previous consolidation around $75,000–$76,000.
The longer-term averages remain lower. Bitcoin’s 100-day moving average stood at $72,276, while its 200-day average was $71,830. $BTC therefore remained above both despite losing its 20-day average and approaching the 50-day line.
The daily MACD added a bearish momentum signal. Its line stood at 1,275.36, below the signal line at 1,828.41, producing a negative histogram reading of 553.05.
Market Context
Bitcoin
BTC
$82,528
+0.50% (24H)
Market Cap
$1.67T
24H Volume
$26.0B
24H High
$83,463
Article Intelligence
Key Entities
Related Coverage
 CryptoBitcoin faces bearish pressure as $1.7B crypto long liquidations hit amid Fed tightening fears.2 小时前 · 1 min read
 CryptoXRP News | XRP ETFs Attract $8M as Bitcoin and Ethereum Funds See Heavy Outflows1 小时前 · 1 min read
 CryptoJUST IN: 🇹🇭 Thailand finalizes rules allowing Bitcoin ETFs to list on the Stock Exchange of Thailand, effective next week 👀 Asia is getting prepared 🚀1 小时前 · 1 min read
Sponsored
Ad
NewsLayerLearn more
NewsLayer Premium
Unlock deeper intelligence.
Ad-free reading, exclusive research, and real-time onchain insights.
Go Premium