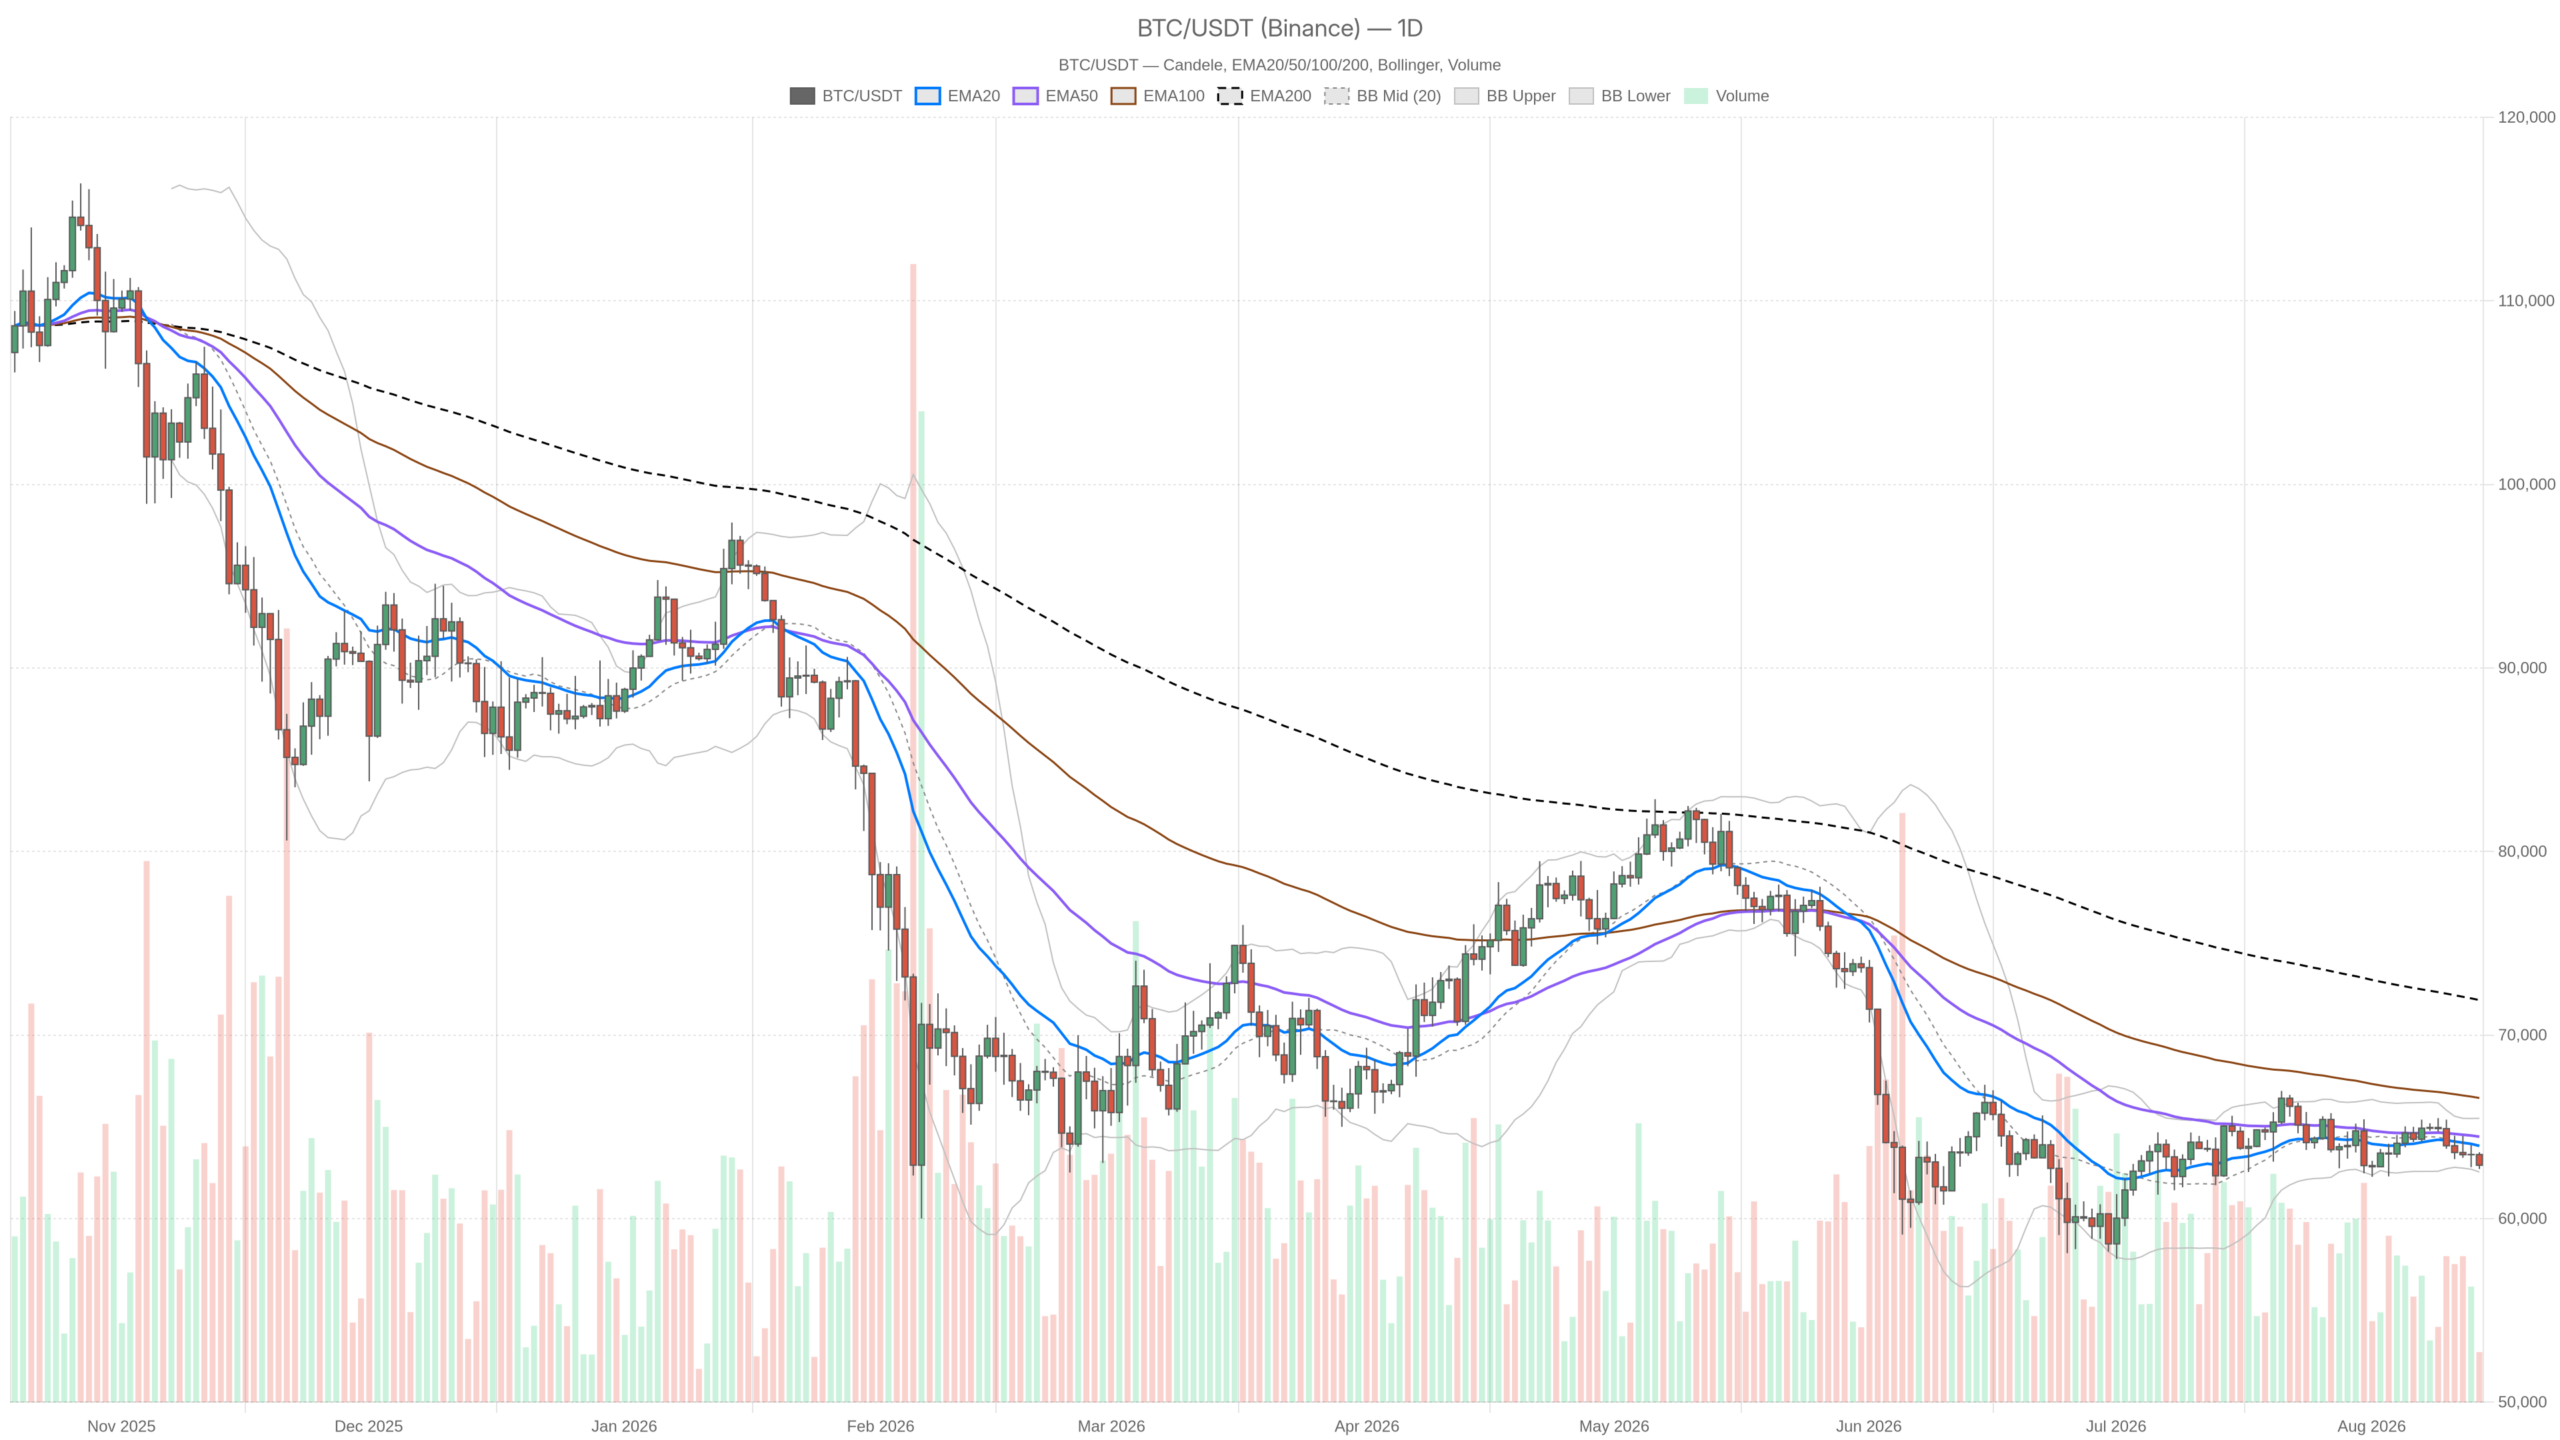
As of August 14, 2026, the Bitcoin price today sits at $62,907 after a grinding, methodical downtrend rather than a sharp crash. Price has slipped below every major daily moving average, and that shift changes how traders should frame risk.
Key takeaways
- Bitcoin traded at $62,907 on August 14, 2026, below all major daily moving averages.
- The Fear & Greed Index sat at 29, squarely in fear territory.
- Daily RSI14 was 42.06, soft but not yet oversold.
- Support near $62,532 aligns with the lower Bollinger Band.
- Bitcoin ETF inflows reached $850 million, per Bloomberg, despite spot weakness.
Market Sentiment: Dominance and Fear
The market’s tone is defensive rather than panicked. Bitcoin dominance stands at 56.08% of a total crypto market cap near $2.247 trillion, which fell 0.92% over 24 hours, according to aggregated market data. That combination suggests capital is leaving the table rather than rotating into alternative assets. The Fear & Greed Index reading of 29 reinforces the read: dip-buyers are not stepping in with conviction.
Daily Chart: The Macro Bias Is Bearish
The daily chart confirms a structural downtrend, not a shallow pullback. Price at $62,907 trades below the EMA20 at $63,961, the EMA50 at $64,462.68, and the EMA200 at $71,907.36. That gap to the 200-period average, close to $9,000, signals a downtrend that has been building for a while.
The daily RSI14 at 42.06 is soft but not yet oversold, so sellers still have room to push. MACD confirms the bearish tone: the line sits at -149.36 against a signal of -4.22, producing a histogram of -145.13. That wide negative histogram reflects momentum still accelerating lower rather than fading. Meanwhile, price hugs the lower Bollinger Band at $62,535.02, with the midline at $63,998.37.
When price rides the lower band this closely, two readings apply. The trend may keep walking the band lower, or the move is stretched enough for a short-term bounce. With RSI still mid-range rather than deeply oversold, the first reading looks more likely. Daily ATR14 of $1,099.93 confirms real volatility. Moreover, the daily pivot at $63,074.82 with support at $62,532.19 lines up almost exactly with the lower band, making that zone the key level to watch.
1H and 15m: Confirmation With a Hint of Fatigue
The lower timeframes confirm the bearish bias while showing early signs of selling fatigue. On the 1-hour chart, price stacks below the EMA20 at $63,298.72, the EMA50 at $63,519.56, and the EMA200 at $63,963.21, and the regime remains bearish. However, RSI14 at 32.59 pushes into oversold territory, suggesting short-term sellers have been aggressive.