BTCUSD — Major Supply Zone Rejection
The $65,000 region is also significant because it represents an area where sellers have previously appeared during Bitcoin’s recovery.
The technical setup shows BTC approaching a major supply zone after forming a sequence of higher lows. That pattern points to improving short-term demand, but the market still needs a convincing breakout to demonstrate that buyers can absorb the available supply.

Bitcoin has rebounded strongly from its lower structure and is now testing a major resistance zone where repeated seller reactions make it a key decision point for the next move. Source: TradingView
A rejection from resistance would not necessarily mean that the broader recovery has ended. However, a sustained move lower accompanied by weakening short-term structure would strengthen the case that Bitcoin is still consolidating within a larger range.
Conversely, a breakout would need more than a brief move above $65,000. Holding above the level and subsequently using it as support would provide stronger technical confirmation that the market has changed character.
This distinction is particularly important for a Bitcoin price forecast because temporary moves through resistance can fail quickly. The technical analysis itself identifies a break-and-hold scenario as the point that would invalidate the bearish setup.
The next upside references are around $67,000 and $67,600. Beyond those levels, previous market analysis has identified the $67,000-$68,000 region as another important resistance area. Forbes reported in July that STS Digital’s Maxime Seiler viewed $67,000-$68,000 as immediate resistance, with $70,000-$72,000 representing a higher upside zone if the structure strengthened.
On the downside, the first area to monitor remains close to $64,000. A loss of that region could shift attention toward $62,500 and the wider on-chain support zone.
Bitcoin TradingView Technical Summary
The latest TradingView technical snapshot presents a mixed but slightly constructive picture for Bitcoin.
The overall rating is Neutral. Oscillators show nine neutral readings, compared with one buy and one sell signal. Moving averages are more positive, with nine buy signals, five sell and one neutral reading.

Bitcoin (BTC) price chart. Source: Brave New Coin
The Relative Strength Index, or RSI, is around 56. That places momentum in neutral territory rather than showing an overbought or oversold condition. The Stochastic %K is near 80, while the Stochastic RSI Fast is around 97. Although those readings point to stronger short-term momentum, they have not been classified as outright buy signals in the snapshot.
The Average Directional Index is around 11. A relatively low ADX suggests that the market does not currently have a strong directional trend. This supports the broader view that BTC remains in consolidation and that a decisive break may be needed before a clearer trend emerges.
The MACD provides one of the more constructive signals. Its level is around 183 and is classified as a buy, while the Momentum indicator produces a sell signal. Taken together, the indicators do not establish a uniform bullish or bearish picture.
The moving-average structure is more favorable over shorter periods. Bitcoin is trading above the 10-, 20-, 30- and 50-period exponential and simple moving averages included in the snapshot. The EMA 50 is around $64,635, while the EMA 10 is approximately $64,450.
Longer-term averages remain a hurdle. The 100-period EMA is around $66,863, the 100-period SMA is approximately $67,865, and the 200-period EMA and SMA are around $72,268 and $70,134, respectively. BTC remains below these levels.
That leaves the Bitcoin technical analysis today with a clear split: short-term indicators have improved, while longer-term trend measures continue to signal overhead resistance.
The classic pivot calculation places the central pivot near $62,491. The first major upside pivot resistance is around $67,248, followed by approximately $71,677. On the downside, the first classic support level is near $58,061.
These figures reinforce the importance of the $65,000-$67,000 area. Bitcoin is trading above its central pivot but remains below several longer-duration resistance measures.
Bitcoin Support Zone Holds Key On-Chain Significance
On-chain data provides another layer to the current Bitcoin price prediction.
Analyst Ali Martinez identified a support zone between approximately $61,849 and $64,374, where more than 2.36 million BTC last moved, based on Glassnode’s UTXO Realized Price Distribution, or URPD.

Glassnode’s URPD data identifies $61,849–$64,374 as a major Bitcoin support zone, with more than 2.36 million BTC last transacted within the range. Source: Ali Martinez via X
URPD is designed to show the distribution of Bitcoin’s supply according to the price at which individual unspent transaction outputs last moved. Glassnode describes the metric as a way of mapping the network’s cost basis across different price ranges.
This makes the $61,849-$64,374 area particularly relevant to the current BTC price structure. A large concentration of coins around a price range can provide useful context for identifying areas where market participants may have significant cost-basis exposure.
Glassnode’s broader research has also shown that Bitcoin has spent extended periods consolidating between major price boundaries. In an April report, the analytics firm described BTC as range-bound between $60,000 and $70,000 and noted that a lack of a clear catalyst could limit the ability of the market to establish a sustained range breakout.
The current structure remains consistent with that broader range-based view. Bitcoin has recovered toward $65,000, but the market has not yet produced enough momentum to establish a decisive move into the upper part of the range.
Bitcoin Price Prediction Today: What Could Come Next?
For the near-term Bitcoin price prediction, $65,000 remains the clearest decision point.
A sustained move above the level would strengthen the short-term bullish structure and shift attention toward $67,000, followed by the $67,600-$68,000 region. A successful retest of $65,000 as support would provide stronger evidence that the breakout has gained acceptance rather than representing a temporary move above resistance.
A failure to clear the level would keep the market vulnerable to another pullback. The first area to watch would be around $64,000, where several shorter-term moving averages are currently clustered. Below that, $62,500 becomes an important technical reference, followed by the broader $61,849-$64,374 on-chain support zone.
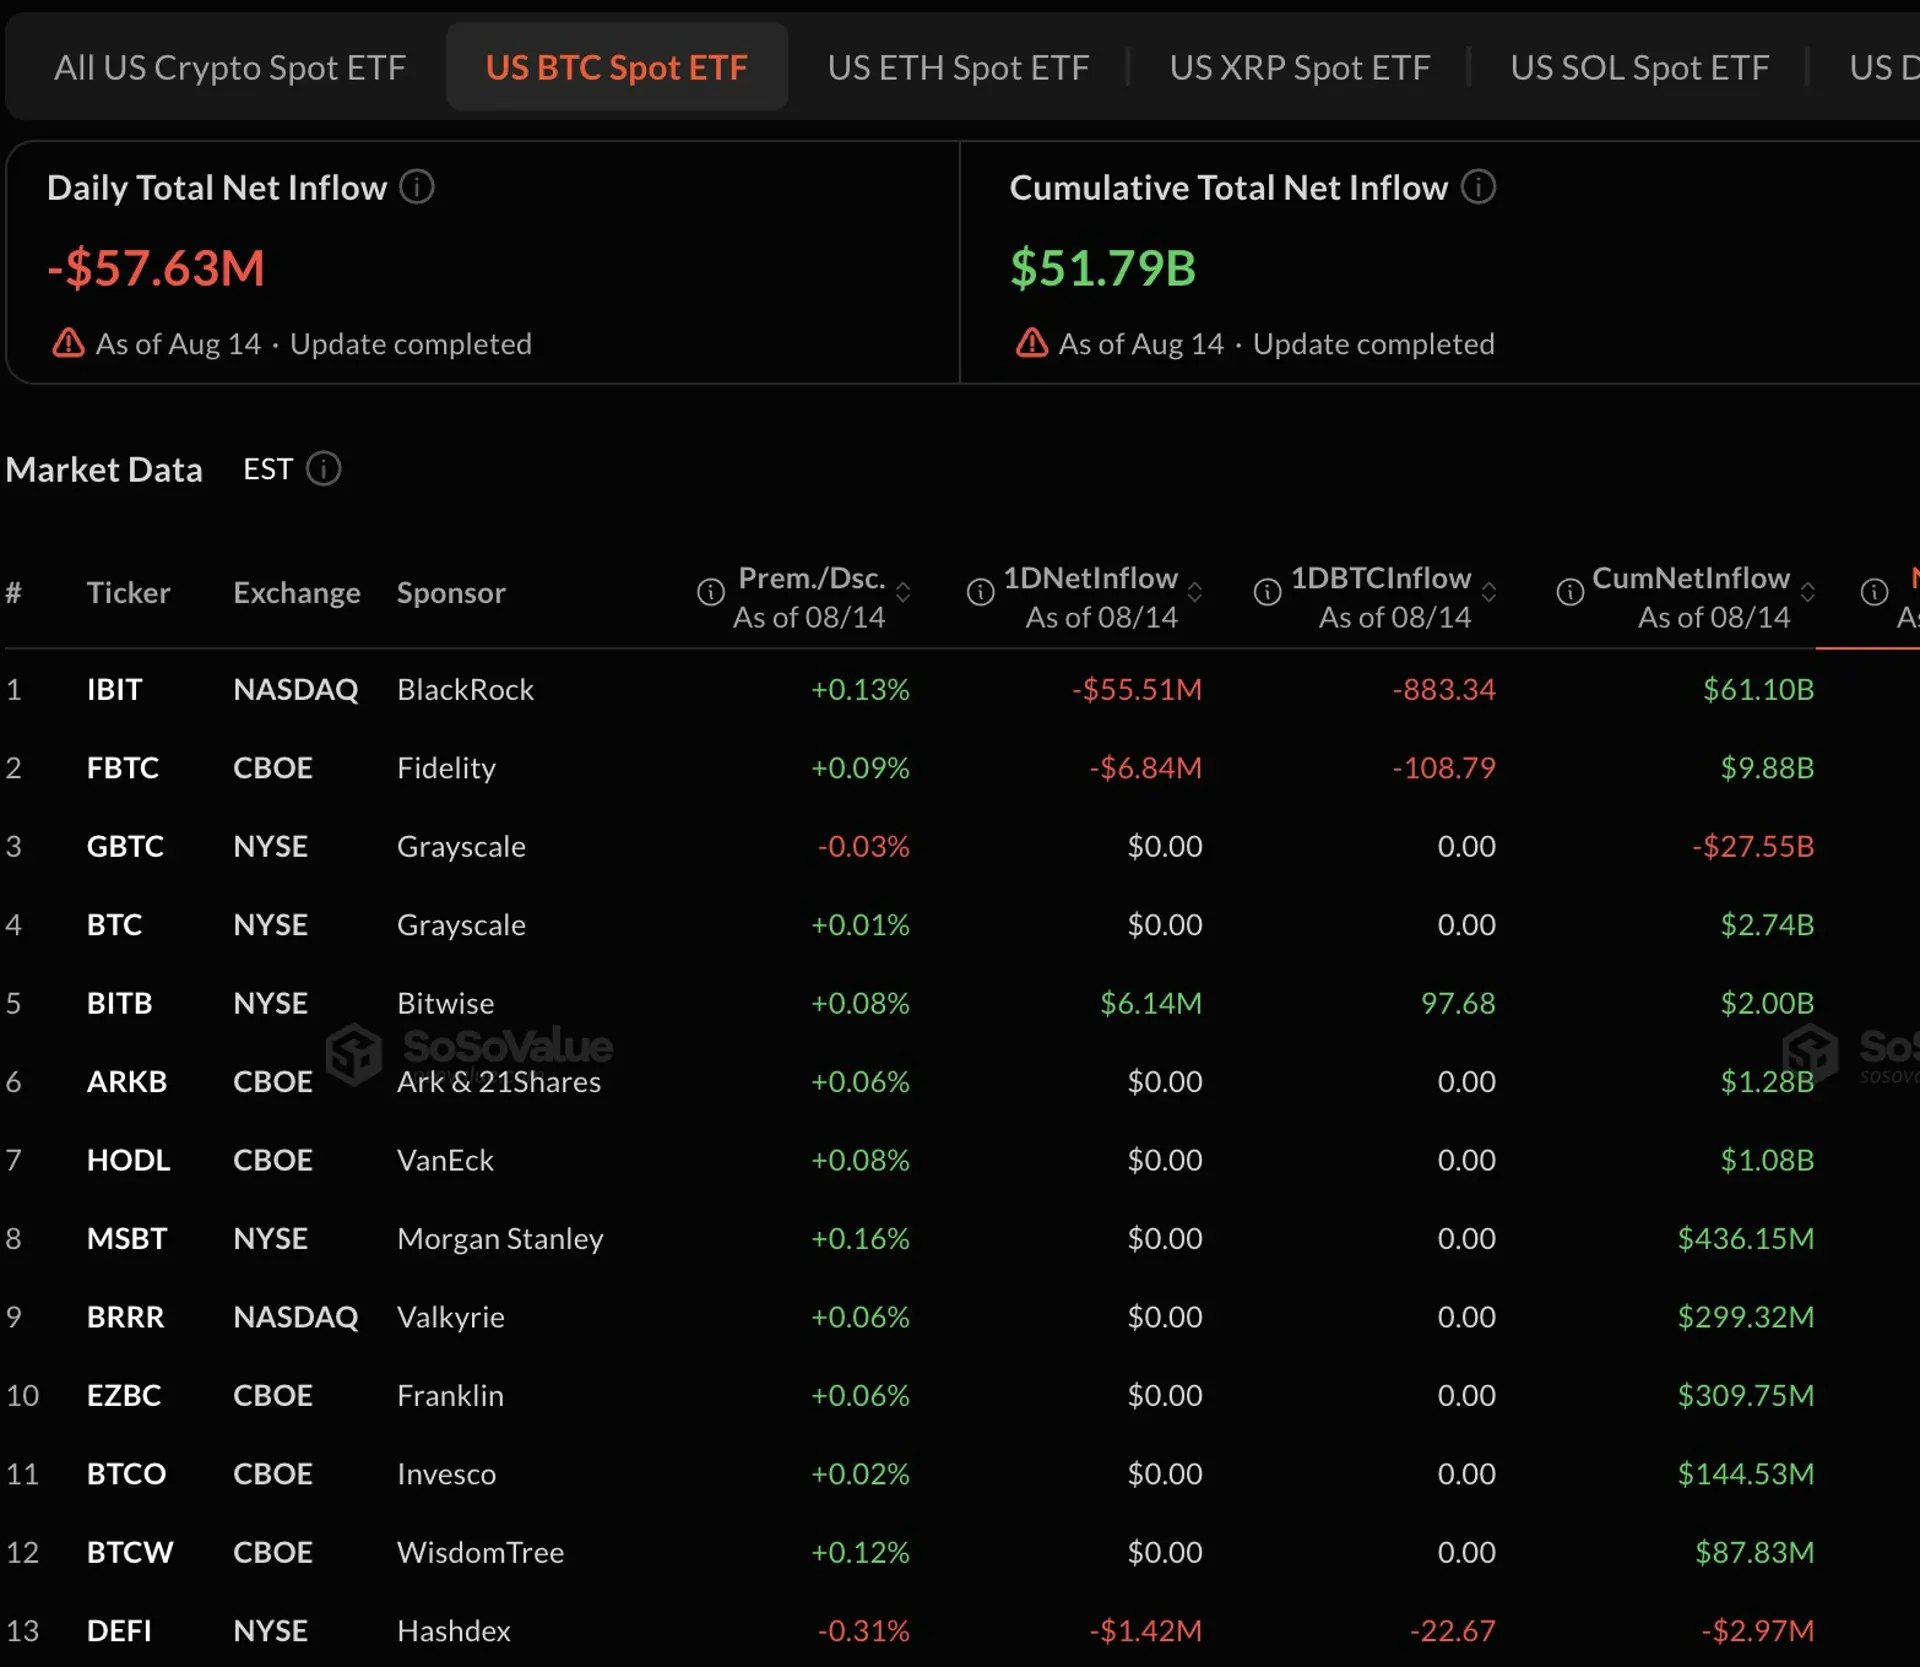
Recent market conditions also suggest that Bitcoin’s recovery remains sensitive to broader demand. Bitcoin has been trading around $65,000 in recent sessions, while reports have pointed to continued ETF flows and institutional demand as factors supporting the market despite its relatively narrow price range.
For now, the technical evidence does not establish a confirmed breakout. Instead, BTC remains caught between improving short-term momentum and substantial overhead resistance.
That makes the next sustained move above or below the current range more important than any single intraday price spike. For traders monitoring the Bitcoin price today, the ability of BTC to hold $65,000 after a breakout could offer a clearer signal than simply touching the level.
As with any Bitcoin price prediction, technical indicators describe potential market conditions rather than guaranteed outcomes. The combination of neutral oscillators, weak trend strength, supportive shorter-term averages and longer-term resistance suggests that confirmation remains important before assigning a stronger directional bias.